2026-06-01__001_synthetic_mine_throughput__opencode__claude-opus-4-8__plan-mode-max-effort
Date: 2026-06-01 · Benchmark: 001_synthetic_mine_throughput · Harness: opencode · Model: claude-opus-4-8 (plan-mode-max-effort) · ✓ Autonomous
Scores
| Category | Points | Max |
|---|---|---|
| Conceptual modelling | 20 | 20 |
| Data and topology | 15 | 15 |
| Simulation correctness | 20 | 20 |
| Experimental design | 14 | 15 |
| Results & interpretation | 15 | 15 |
| Code quality | 9 | 10 |
| Traceability | 5 | 5 |
| Total | 98 | 100 |
Run metrics
-
Total tokens:
—(method:unknown) -
Input / output tokens:
—/— - Runtime:
1.05 s -
Reviewer model:
unknown· harness:claude-code· on2026-06-01 - Recommendation: Exemplary submission
- Notes: opencode + Claude Opus 4.8 (plan-mode, max-effort): reference-quality SimPy DES; 57/57 automated + all 6 behavioural checks; runs reproduce exactly and inputs are byte-identical to the benchmark. Independently verified that the narrow ramp is off the loaded-haul cycle, so ramp_upgrade/ramp_closed correctly move throughput <2% (not a bug); crusher identified as the binding constraint with an optional crusher_debottleneck scenario (+14.7%). Minor: token_usage unrecorded (harness limitation), self-timed run_metrics, single 762-line model module, and CRN 'paired comparison' claim slightly overstated.
Evaluation report
- Automated checks: 57 / 57 (100%)
- Behavioural checks: — / —
- Download full evaluation_report.json
| Scenario | Mean throughput |
|---|---|
| baseline | 12,953.3 |
| trucks_4 | 7,753.3 |
| trucks_12 | 13,033.3 |
| ramp_upgrade | 12,983.3 |
| crusher_slowdown | 6,513.3 |
| ramp_closed | 12,803.3 |
| crusher_debottleneck | 14,853.3 |
Source files
- README.md
- additional_scenarios/crusher_debottleneck.yaml
- conceptual_model.md
- data/dump_points.csv
- data/edges.csv
- data/loaders.csv
- data/nodes.csv
- data/scenarios/baseline.yaml
- data/scenarios/crusher_slowdown.yaml
- data/scenarios/ramp_closed.yaml
- data/scenarios/ramp_upgrade.yaml
- data/scenarios/trucks_12.yaml
- data/scenarios/trucks_4.yaml
- data/trucks.csv
- mine_sim.py
- plot_topology.py
- prompt.md
- requirements.txt
- results/evaluation_report.json
- results.csv
- run_experiment.py
- run_metrics.json
- submission.yaml
- summary.json
- token_usage.json
Downloads
Conceptual model
Conceptual Model — Synthetic Mine Throughput
A discrete-event simulation (DES) of ore haulage in a synthetic open-pit mine, built in SimPy. The model estimates ore tonnage delivered to the primary crusher over an 8-hour shift and the queueing behaviour of the haulage system.
This document is the conceptual model: it states what is modelled and why,
independently of the code. The implementation lives in mine_sim.py
(model) and run_experiment.py (experiment harness).
1. System boundary
Purpose / question. How much ore reaches the primary crusher (CRUSH)
during one 8-hour shift, where are the bottlenecks, and how does throughput
respond to fleet size, a ramp upgrade, a ramp closure, and a slower crusher?
Included in the model
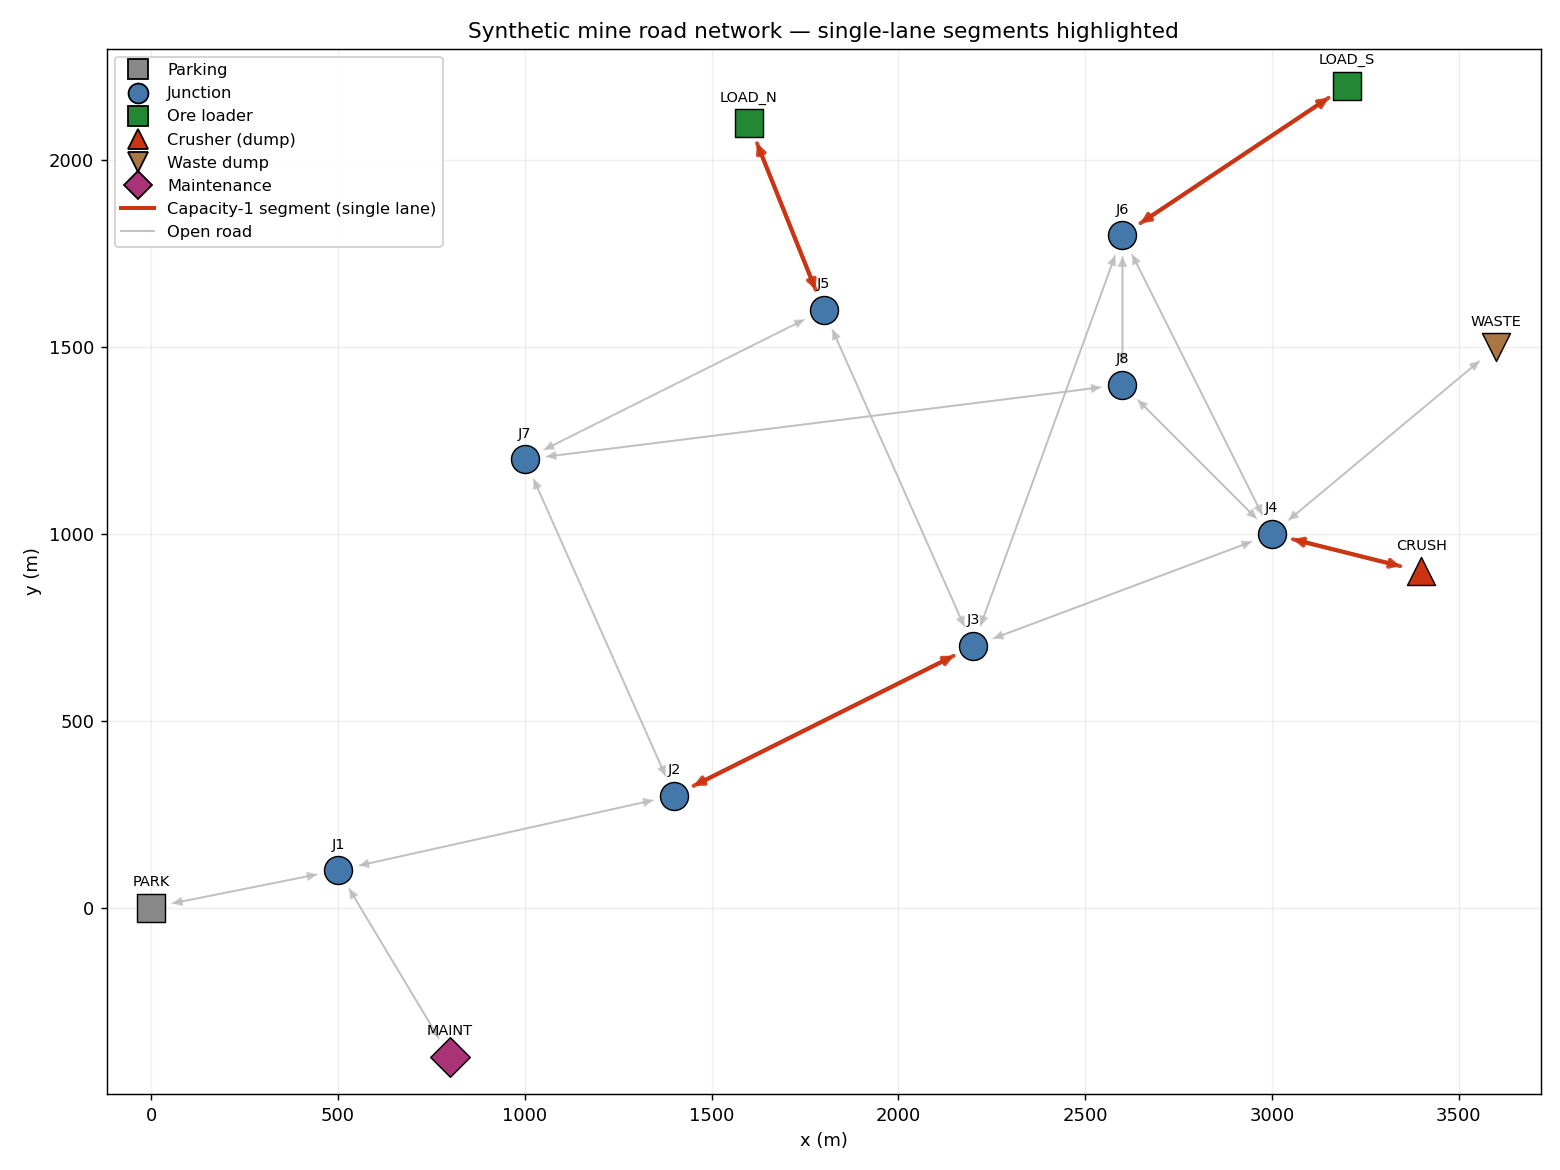
- The directed road network from
nodes.csv/edges.csv(14 nodes, 34 directed edges) and travel along it as time-consuming events. - The haulage fleet (trucks) as active entities that cycle load → haul → dump → return.
- The two ore loaders (
L_Nat the North face,L_Sat the South face) as single-server resources. - The primary crusher (
D_CRUSHat nodeCRUSH) as the ore dump, a single-server resource. - Capacity-constrained road segments (capacity < 999 in the data) as shared
resources: the narrow ramp (
E03_*), the crusher approach (E05_*) and the two single-lane pit-access roads (E07_*,E09_*). - Stochastic load, dump and travel times.
Excluded (out of boundary)
- Waste mining and the waste dump (
WASTE/D_WASTE). The production config sends ore only toCRUSH; the waste route exists in the graph but is never a destination, so no waste cycle is modelled. - The maintenance bay (
MAINT): availability is 1.0 for all equipment in the data, so no breakdowns, refuelling or scheduled maintenance are modelled. - Crusher downstream processing (stockpile, plant): the crusher is modelled only as a dump server with a service time.
- Shift changes, breaks, blasting windows, weather and operator skill.
- Grade/rimpull physics: edge speed limits are taken directly from the data.
2. Entities (things that move through the system)
| Entity | Count | Attributes (from data) |
|---|---|---|
| Truck | 4 / 8 / 12 by scenario | payload_tonnes = 100, empty_speed_factor = 1.00, loaded_speed_factor = 0.85, start_node = PARK |
Ore is not modelled as a separate entity; each completed dump moves a fixed truck payload (100 t) to the crusher, so tonnage is a counter incremented on dump completion. Trucks are the only active SimPy processes.
3. Resources (things that constrain the system)
| Resource | Servers (capacity) | Service / hold time | Source |
|---|---|---|---|
Loader L_N | 1 | load ~N(6.5, 1.2) min | loaders.csv |
Loader L_S | 1 | load ~N(4.5, 1.0) min | loaders.csv |
Crusher D_CRUSH | 1 | dump ~N(3.5, 0.8) min | dump_points.csv |
Ramp E03_UP, E03_DOWN | 1 each | edge travel time | edges.csv (capacity = 1) |
Crusher approach E05_TO_CRUSH, E05_FROM_CRUSH | 1 each | edge travel time | edges.csv (capacity = 1) |
Pit road E07_* (North), E09_* (South) | 1 each | edge travel time | edges.csv (capacity = 1) |
Edges with capacity ≥ 999 are treated as unconstrained (free-flowing) and
incur only a travel delay, not a resource request. A truck holds a
constrained edge resource for the duration of its traversal, so only one truck
occupies a single-lane segment at a time.
4. Events
The per-truck cycle generates the following discrete events (all logged for
replication 0 of each scenario in event_log.csv):
dispatch— truck is assigned to a loader (start of shift, or after a dump).enter_edge— truck begins traversing a road segment (one per edge on the shortest-time route; recordsfrom_node/to_nodeand, for constrained edges, the queue length).queue_loader— truck joins the loader queue (records queue length).load_start/load_end— loading begins / ends (payload acquired).enter_edge(loaded) — loaded haul toward the crusher.queue_crusher— truck joins the crusher dump queue (records queue length).dump_start/dump_end— dumping begins / ends. Tonnage is recorded ondump_end(a completed dump), which is the throughput measure.
The empty return to the next loader is the first leg of the next dispatch,
so the cycle repeats until the shift clock (env.run(until = 480 min)) stops
the simulation. Activities still in progress at the clock boundary are not
counted, so only completed dumps contribute tonnage.
5. State variables
Per truck: current node/location; loaded vs empty; cumulative travel, load and dump time; cumulative time queued at loaders and at the crusher; timestamps of successive loadings (for cycle-time calculation).
Per resource: busy time (for utilisation); queue length (instantaneous) and queue waiting time (per request).
System: simulation clock; total tonnes delivered; number of completed dumps; committed-assignment counts per loader (used by the dispatcher).
6. Assumptions
6a. Derived from the data (facts the data dictates)
- Two ore faces (
LOAD_N,LOAD_S); one ore dump (CRUSH). Baseline fleet is 8 trucks; sensitivity runs use 4 and 12. - Payload 100 t; loaded trucks travel at 0.85× the posted edge speed, empty at 1.00×.
- Loader, crusher and edge capacities and service-time distributions are taken
verbatim from the CSVs; scenario YAMLs override them via
*_overrides. - The ramp
E03, crusher approachE05, and pit roadsE07/E09are the only capacity-1 (single-lane) segments; everything else has capacity 999. - Topology fact (important): on the supplied graph the shortest-time loaded
haul from either pit to the crusher (
LOAD_N → J5 → J3 → J4 → CRUSH,LOAD_S → J6 → J4 → CRUSH) does not use the ramp. The ramp connects the parking/gate area to the production area, so it is traversed only when a truck first positions itself at the South pit (the North pit is reached faster via the bypass even in the baseline). This is verifiable fromedges.csvand is the reason the ramp is a start-of-shift constraint, not a per-cycle one.
6b. Introduced by the modeller (choices not dictated by the data)
- Trucks start empty at
PARKand are dispatched to a loader; they then cycle loader↔crusher and are not returned toPARKbetween cycles. - Routing: shortest-time path (edge weight = distance ÷ max speed), per
the baseline
routing.objective. A single graph serves loaded and empty routing because the truck speed factor is a uniform multiplier. - Dispatch: nearest-available-loader. Each loader is scored by the estimated time until this truck would start loading = travel time + (committed trucks ahead × mean load time); ties and the documented secondary objective are broken by shortest expected full cycle time. A committed-assignment counter prevents all trucks herding onto the nominally nearest loader.
- Stochasticity: load and dump times are truncated normal (resampled to stay
positive). Each edge traversal time is multiplied by independent log-normal
noise with mean 1 and CV 0.10 (
travel_time_noise_cv). - Bidirectional single-lane roads are modelled as two independent one-way capacity-1 resources (matching the data’s separate-edge representation).
- No warm-up (
warmup_minutes = 0in every scenario): the whole shift, including the start-up transient, is measured, which matches a whole-shift tonnage question. The start-up transient is visible in the event log. - Truck utilisation counts only productive time (travel + load + dump); time queued at a resource is treated as non-productive.
6c. Limitations
See summary.json → model_limitations. In brief: the ramp is off the loaded
haul cycle on this topology (so ramp scenarios move throughput only a few
percent); two-way roads are modelled as independent one-way lanes; there is no
grade/rimpull haul-physics engine; loaders/crusher are simple single servers
with no spotting time, breaks or breakdowns.
7. Performance measures
Computed per replication, then aggregated across replications with a 95% Student-t confidence interval (n = 30):
| Measure | Definition |
|---|---|
total_tonnes_delivered | payload × completed dumps at CRUSH within the shift |
tonnes_per_hour | total tonnes ÷ measured hours (8) |
average_truck_cycle_time_min | mean time between successive loadings of a truck |
average_truck_utilisation | mean over trucks of (travel + load + dump) ÷ shift |
crusher_utilisation | crusher busy time ÷ (shift × crusher capacity) |
loader_utilisation (per loader) | loader busy time ÷ (shift × loader capacity) |
| road-segment utilisation | constrained-edge busy time ÷ (shift × edge capacity) |
average_loader_queue_time_min | mean wait in the loader queue per load |
average_crusher_queue_time_min | mean wait in the crusher queue per dump |
top_bottlenecks | resources ranked by mean utilisation, with mean queue time |
Throughput is therefore an emergent result of the simulated load–haul–dump– return cycle and resource contention, never a static or closed-form calculation.
README
Synthetic Mine Throughput — SimPy Discrete-Event Simulation
A reproducible SimPy DES that estimates ore throughput to the primary crusher over an 8-hour shift, identifies bottlenecks, and answers the operator’s decision questions through scenario analysis.
- Model:
mine_sim.py(data loading, scenario resolution, routing, SimPy model) - Experiment harness:
run_experiment.py(scenarios × replications, aggregation, output files) - Conceptual model:
conceptual_model.md - Optional plot:
plot_topology.py→topology.png
1. Install dependencies
Python 3.11+ is required. From this folder:
python3 -m venv .venv && source .venv/bin/activate
pip install -r requirements.txt
The model itself needs only simpy, numpy, scipy, pyyaml, networkx.
matplotlib is needed only for the optional topology plot.
2. Run the simulation
python3 run_experiment.pyThis runs all six required scenarios plus one optional agent-proposed scenario, 30 replications each (≈1–2 s total), and (re)writes the deliverables into this folder:
| File | Contents |
|---|---|
results.csv | one row per (scenario, replication) with all metrics |
summary.json | per-scenario means, 95% CIs, bottleneck ranking, assumptions |
event_log.csv | full event trace of replication 0 of each scenario |
run_metrics.json | self-timed wall-clock runtime / return code |
Useful flags:
python3 run_experiment.py --scenarios baseline,ramp_closed   # subset
python3 run_experiment.py --replications 100                 # more reps
python3 run_experiment.py --log-replication 5                # log a different rep
python3 run_experiment.py --help
3. Reproduce the required scenario results
Results are deterministic. Replication r of every scenario uses
seed = base_random_seed (12345) + r, so the same seed index is reused across
scenarios (common random numbers) for paired comparison. Re-running
python3 run_experiment.py reproduces results.csv / summary.json exactly on
the same NumPy version. The optional topology figure is produced with:
python3 plot_topology.py # writes topology.png4. Conceptual model (summary)
Full detail is in conceptual_model.md. In brief: trucks are active SimPy
processes that cycle load → haul → dump → return. Loaders, the crusher and
the capacity-1 road segments (ramp, crusher approach, pit roads) are SimPy
resources. Trucks start empty at PARK, are dispatched to a loader, then cycle
between the pits and the crusher until the 480-minute shift clock stops the run.
Tonnage is counted only on completed dump events at the crusher.
5. Main assumptions
The full list (split into data-derived and introduced) is in
conceptual_model.md §6 and summary.json → key_assumptions. The decision-
critical ones:
- Ore goes only to
CRUSH; waste and maintenance are out of boundary; all equipment availability is 1.0 (no breakdowns). - Loading/dumping times are truncated-normal (data means/SDs); per-edge travel time carries log-normal noise (mean 1, CV 0.10) on top of distance ÷ (max speed × truck speed factor), with loaded trucks at 0.85×.
- Capacity-1 roads are single-lane resources; the two directions of a physical road are independent one-way resources (as the data represents them).
- Topology fact: the narrow ramp
E03is not on the loaded-haul cycle — loaded hauls runpit → J3/J4 → CRUSHand never cross it. The ramp connects the parking area to the production area, so it is only used for start-of-shift positioning (and only by South-bound trucks; the North pit is reached faster via the bypass even in the baseline).
6. Routing and dispatching logic
- Routing — shortest time. The road graph is a NetworkX
DiGraphwith edge weight = distance ÷ max speed. Routes are the shortest-time paths between the parking area, the two loaders and the crusher. A uniform truck speed factor does not change which path is shortest, so one graph serves both loaded and empty legs. If a required origin/destination pair has no path (e.g. a closure with no detour), the model raisesRouteErrorand stops rather than silently under-reporting. Closing the ramp (ramp_closed) automatically reroutes traffic onto the bypassJ2 → J7 → J8 → …. - Dispatching — nearest available loader. When a truck needs an assignment, each loader is scored by the estimated time until this truck starts loading = travel time to the loader + (committed trucks already heading there × mean load time). The lowest score wins; ties and the configured secondary objective are broken by shortest expected full cycle time. A committed- assignment counter stops the whole fleet herding onto the nominally nearest loader and naturally balances trucks between the faster South face and the slower-but-closer North face.
7. Key results
30 replications per scenario, 8-hour shift. Tonnes are mean ± 95% CI.
| Scenario | Tonnes (95% CI) | t/h | Cycle (min) | Truck util | Crusher util | Crusher queue (min) |
|---|---|---|---|---|---|---|
| baseline (8 trucks) | 12,953 [12,872–13,035] | 1,619 | 28.1 | 0.81 | 0.94 | 4.3 |
| trucks_4 | 7,753 [7,728–7,779] | 969 | 23.8 | 0.96 | 0.56 | 0.6 |
| trucks_12 | 13,033 [12,924–13,143] | 1,629 | 40.8 | 0.56 | 0.95 | 16.5 |
| ramp_upgrade | 12,983 [12,911–13,056] | 1,623 | 28.1 | 0.81 | 0.95 | 4.3 |
| crusher_slowdown | 6,513 [6,441–6,586] | 814 | 54.1 | 0.49 | 0.95 | 27.5 |
| ramp_closed | 12,803 [12,726–12,880] | 1,600 | 28.3 | 0.80 | 0.94 | 4.6 |
| crusher_debottleneck (proposed) | 14,853 [14,805–14,902] | 1,857 | 24.7 | 0.91 | 0.54 | 0.05 |
8. Answers to the operational decision questions
Q1 — Expected baseline throughput? ≈ 12,950 tonnes per 8-hour shift (1,619 t/h), 95% CI [12,872, 13,035], about 129–130 truck loads. The crusher runs at 94% utilisation, so the shift is close to the crusher’s practical ceiling (~13,700 t at zero idle).
Q2 — Likely bottlenecks?
The primary crusher D_CRUSH is the binding constraint (94% utilisation,
4.3-minute average dump queue). Behind it sit the loaders (L_S 77%, L_N
70%) and then the crusher approach E05 (44%). The narrow ramp is not a
steady-state bottleneck on this topology (≈3% utilisation) — see Q4/Q6.
Q3 — Do more trucks help, or does the system saturate? It saturates at the crusher. Going 4→8 trucks adds +5,200 t (+67%); going 8→12 adds only +80 t (+0.6%). At 12 trucks, truck utilisation collapses from 0.81 to 0.56 and the crusher queue rises to 16.5 min — the extra trucks simply wait in line. Eight trucks is already near the efficient fleet size; adding trucks does not buy crusher throughput.
Q4 — Would improving the narrow ramp help? Negligibly: +0.2% (12,983 vs 12,953, CIs overlap). The loaded haul never uses the ramp, so upgrading it only marginally speeds the South pit’s start-of-shift positioning. The ramp upgrade is not justified by throughput (it may still be worth it for safety, cycle-time variance or redundancy).
Q5 — Sensitivity to crusher service time? Very high — this is the dominant lever. Doubling the dump time (3.5 → 7.0 min) cuts throughput by 50% to 6,513 t and pushes the crusher queue to 27.5 min and cycle time to 54 min. Throughput tracks the crusher service rate almost one-for-one.
Q6 — Operational impact of losing the main ramp? Small for throughput: −1.2% (12,803 vs 12,953). The model reroutes onto the bypass automatically (all routes stay feasible). The real costs are start-of-shift delay (South-bound trucks take the longer bypass) and loss of route redundancy, not steady-state tonnage — because the ramp is off the loaded-haul cycle.
Optional proposed scenario — crusher_debottleneck.
Adding a second crusher dump bay and approach lane lifts throughput
+14.7% to 14,853 t and moves the bottleneck to the South loader L_S
(utilisation 0.90). This is the highest-leverage intervention and confirms
the crusher is what caps the baseline.
9. Likely bottlenecks (ranked, baseline)
D_CRUSH— primary crusher, util 0.94, mean dump queue 4.3 min (binding).L_S— South loader, util 0.77.L_N— North loader, util 0.70.E05_TO_CRUSH— crusher approach, util 0.44 (all trucks funnel through it).- South pit road
E09_*, util ~0.40.
The ramp (E03) sits at ~0.03 utilisation — confirmed not a bottleneck here.
10. Limitations
See summary.json → model_limitations and conceptual_model.md §6c. Key points:
the ramp is off the loaded-haul cycle on this topology (so ramp scenarios move
throughput only a few percent); two-way single-lane roads are modelled as
independent one-way lanes (understates head-on contention); there is no
grade/rimpull haul-physics engine; loaders and the crusher are simple single
servers with no spotting time, breaks or breakdowns; truck utilisation excludes
queueing time. Results are conditional on these assumptions and should be read
as decision-support, not absolute predictions.
11. Suggested improvements and further scenarios
- Debottleneck the crusher first (proposed scenario): a second dump bay buys ~+15% throughput — far more than any fleet change.
- After that, the South loader becomes binding — evaluate a faster or second loader at the South face, or rebalancing dispatch toward the North face.
- Combined ramp + crusher scenario to confirm the ramp adds nothing even when the crusher is relieved.
- Availability/breakdowns: add MTBF/MTTR and refuelling at
MAINTto test robustness (currently availability is 1.0). - Single-lane ramp realism: model
E03as one shared bidirectional lane to test head-on contention under heavier ramp use. - Payload / speed-factor sensitivity to bound the throughput estimate.
Run notes / interventions
Built and validated in a single autonomous session (plan → implement → smoke
test → 30-rep run → benchmark public tests + automated harness). Stochastic
behaviour, seed control and ≥30 replications are all in place; the six required
behavioural sanity checks pass. token_usage.json is left as unknown because
the harness used here does not expose exact token counts; run_metrics.json is
self-timed by run_experiment.py.