2026-06-01__001_synthetic_mine_throughput__claude-code__claude-opus-4-8__plan-mode-max-effort
Date: 2026-06-01 · Benchmark: 001_synthetic_mine_throughput · Harness: claude-code · Model: claude-opus-4-8 (plan-mode-max-effort) · ? Unrecorded
Scores
| Category | Points | Max |
|---|---|---|
| Conceptual modelling | 19 | 20 |
| Data and topology | 15 | 15 |
| Simulation correctness | 19 | 20 |
| Experimental design | 14 | 15 |
| Results & interpretation | 15 | 15 |
| Code quality | 10 | 10 |
| Traceability | 5 | 5 |
| Total | 97 | 100 |
Run metrics
-
Total tokens:
—(method:unknown) -
Input / output tokens:
—/— - Runtime:
2.8 s -
Reviewer model:
unknown· harness:claude-code· on2026-06-01 - Recommendation: Exemplary submission
- Notes: claude-code + Claude Opus 4.8 (plan-mode, max-effort): 57/57 automated + all 6 behavioural checks; re-ran the canonical run and summary.json/results.csv reproduce bit-for-bit; inputs byte-identical to the benchmark and the 78-test pytest suite passes. Clean 16-module immutable SimPy package (one process per truck, capacity-1 edges as Resources, Dijkstra shortest-time routing with loud reachability check, SeedSequence streams, Student-t CIs). Independently verified by hand that the loaded LOAD->CRUSH legs never use the narrow ramp, so the crusher is correctly the binding constraint and ramp_upgrade/ramp_closed move throughput <2% (not a bug). Minor: average_truck_utilisation folds queue-wait into productive time so it sits at ~0.99 everywhere (low information); token_usage unrecorded (harness limitation); intervention.category 'plan-mode' is non-canonical and renders as 'unrecorded'; saturation knee between 4 and 8 trucks not pinpointed.
Evaluation report
- Automated checks: 57 / 57 (100%)
- Behavioural checks: — / —
- Download full evaluation_report.json
| Scenario | Mean throughput |
|---|---|
| baseline | 12,546.667 |
| trucks_4 | 7,650 |
| trucks_12 | 12,906.667 |
| ramp_upgrade | 12,606.667 |
| crusher_slowdown | 6,513.333 |
| ramp_closed | 12,363.333 |
| trucks_12_ramp_upgrade | 12,953.333 |
Source files
- README.md
- conceptual_model.md
- data/dump_points.csv
- data/edges.csv
- data/loaders.csv
- data/nodes.csv
- data/scenarios/baseline.yaml
- data/scenarios/crusher_slowdown.yaml
- data/scenarios/ramp_closed.yaml
- data/scenarios/ramp_upgrade.yaml
- data/scenarios/trucks_12.yaml
- data/scenarios/trucks_12_ramp_upgrade.yaml
- data/scenarios/trucks_4.yaml
- data/trucks.csv
- prompt.md
- requirements.txt
- results/evaluation_report.json
- results.csv
- run_metrics.json
- src/mine_sim/__init__.py
- src/mine_sim/__main__.py
- src/mine_sim/aggregate.py
- src/mine_sim/cli.py
- src/mine_sim/events.py
- src/mine_sim/io_writers.py
- src/mine_sim/metrics.py
- src/mine_sim/model.py
- src/mine_sim/narrative.py
- src/mine_sim/rng.py
- src/mine_sim/routing.py
- src/mine_sim/runner.py
- src/mine_sim/scenario_runner.py
- src/mine_sim/scenarios.py
- src/mine_sim/topology.py
- src/mine_sim/viz.py
- submission.yaml
- summary.json
- token_usage.json
Downloads
Conceptual model
Conceptual Model — Synthetic Mine Ore Haulage (Benchmark 001)
A discrete-event simulation (SimPy) of an 8-hour ore haulage shift in a
synthetic open-pit mine. It estimates ore throughput to the primary crusher
and quantifies the effect of fleet size, ramp capacity, and crusher service
time. This document is the design record; numeric results live in
summary.json / results.csv and are discussed in README.md.
1. System boundary
Included
- The ore-haulage cycle from the truck park (
PARK) to the two ore faces (LOAD_N,LOAD_S) and to the primary crusher (CRUSH). - The directed road graph from
nodes.csv/edges.csv, including the main ramp and the western/eastern bypass routes. - The two loaders (
L_N,L_S) and the crusher (D_CRUSH) as service resources. - The eight single-lane (capacity-1) road segments as shared resources.
- Stochastic travel, loading, and dumping times.
Excluded (out of scope)
- Waste haulage and the waste dump (
WASTE/D_WASTE). The task is ore to the crusher; waste edges remain in the graph for completeness but carry no traffic. - Maintenance / refuelling (
MAINT). No truck ever visits the maintenance bay; trucks are available for the whole shift. - Truck breakdowns and availability < 1.0.
trucks.csvlistsavailability = 1.00; we honour that, so the estimate is an upper bound on a fully-available fleet. - Operator behaviour: shift handover, breaks, and manual dispatcher overrides are not modelled.
- Downstream of the crusher: no stockpile back-pressure or full-bin blocking; the crusher is always ready to receive.
2. Entities
| Entity | Role | Source |
|---|---|---|
| Truck | The only active (moving) entity. One SimPy process per truck runs the haul cycle: choose loader → travel empty → load → travel loaded → dump → repeat. | trucks.csv (T01–T12; first N used per scenario) |
| Ore payload | Not a separate process. Carried implicitly by a loaded truck and credited as payload_tonnes (100 t) at each completed dump. | trucks.csv |
All trucks are homogeneous: 100 t payload, empty speed factor 1.00, loaded
speed factor 0.85, and they all start at PARK.
3. Resources (what constrains the system)
Every constrained resource is a SimPy Resource with capacity 1 (one truck
served at a time, others queue FIFO).
| Resource | Count | Service parameters |
|---|---|---|
Loaders L_N, L_S | 2 | truncated-normal load time; L_N 6.5 / 1.2 min, L_S 4.5 / 1.0 min |
Crusher D_CRUSH | 1 | truncated-normal dump time 3.5 / 0.8 min (7.0 / 1.5 in crusher_slowdown) |
| Capacity-1 edges | 8 | one resource per directed single-lane segment |
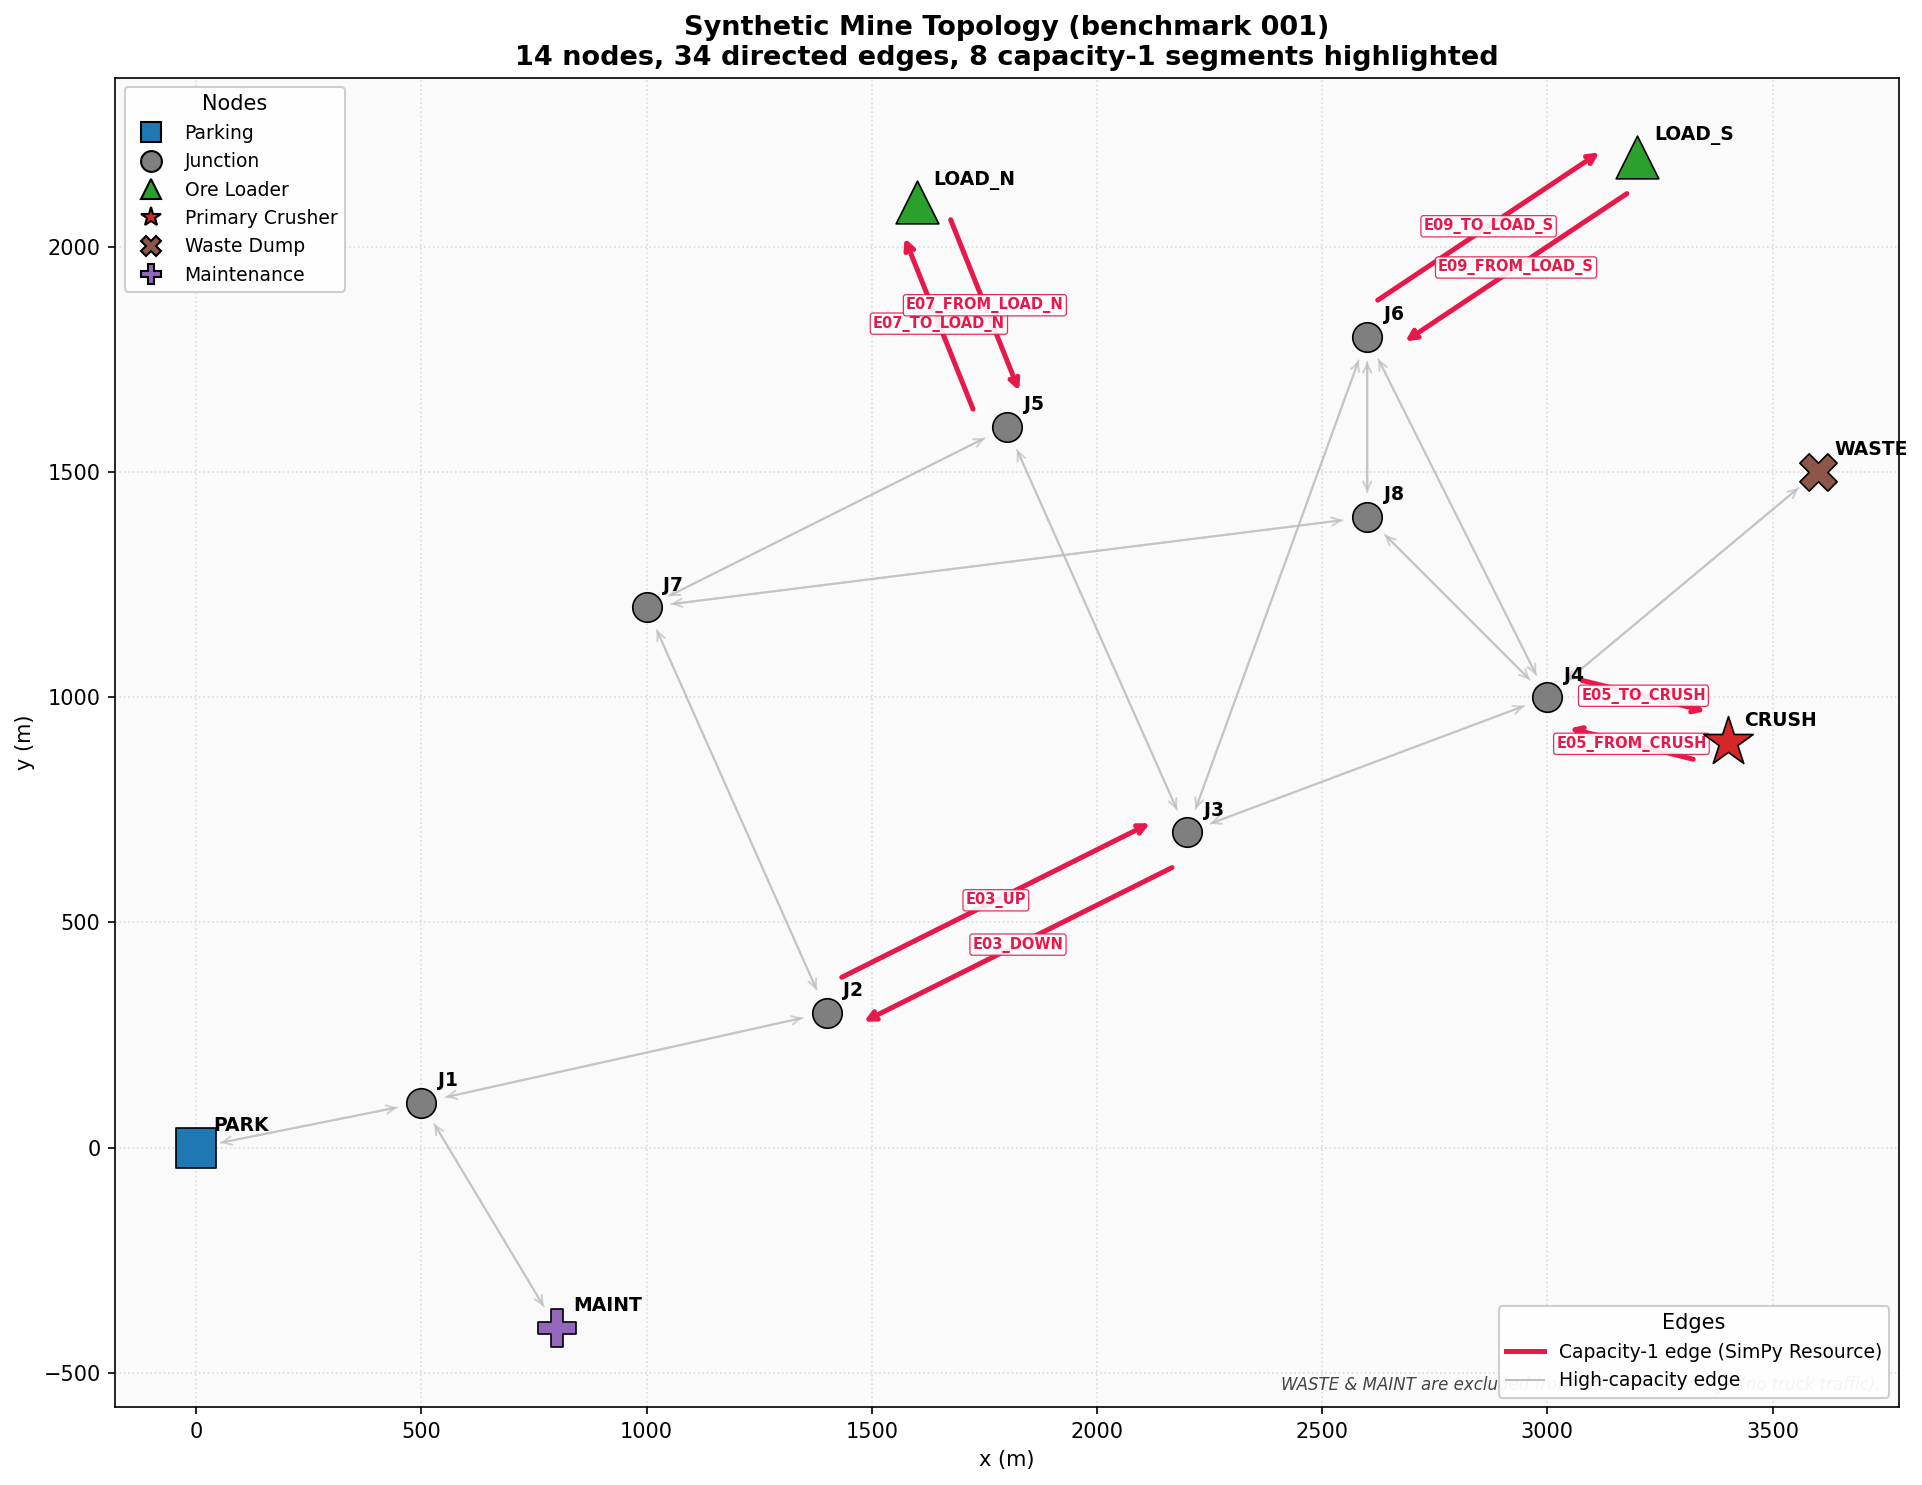
The eight capacity-1 edges (the only capacity = 1 rows in edges.csv) are:
E03_UP,E03_DOWN— the narrow main ramp (J2 ↔ J3), the “intended transport bottleneck”.E05_TO_CRUSH,E05_FROM_CRUSH— the crusher approach road (J4 ↔ CRUSH).E07_TO_LOAD_N,E07_FROM_LOAD_N— the North pit-face road (J5 ↔ LOAD_N).E09_TO_LOAD_S,E09_FROM_LOAD_S— the South pit-face road (J6 ↔ LOAD_S).
Each physical direction is modelled as its own capacity-1 resource (e.g.
E03_UP and E03_DOWN are independent), so opposing trucks do not contend
for a single shared lane. This is a documented simplification (see §6).
All other edges have capacity = 999 and are modelled as plain time delays
(no resource contention).
4. Events
The per-truck cycle generates these events (all recorded to event_log.csv):
dispatch— truck released atPARKat t = 0.edge_enter/edge_leave— acquiring / releasing each capacity-1 edge along a route (brackets the time the truck holds the single lane).arrive_loader— truck reaches the chosen loading face and joins its queue.start_load/end_load— loader service begins / ends.depart_loader— truck leaves loaded.arrive_crusher— truck reaches the crusher and joins its queue.start_dump/end_dump— crusher service begins / ends. Tonnes are credited atend_dump(and only if it closes before the shift cut).depart_crusher— truck leaves empty; the loop repeats.
Free-flow (capacity-999) edges advance time with a plain timeout and emit no
edge events, keeping the log focused on the constrained segments.
5. State variables
Tracked during the run:
- Truck location and loaded/empty status (implicit in the process position).
- Queue length at each loader, the crusher, and each capacity-1 edge
(
count + len(queue)), sampled into the event log. - Resource busy time (loaders, crusher, edges) for utilisation.
- Per-truck productive time (sum of completed wait + service + travel phases).
- Per-truck completed cycle count and total cycle time.
- Completed dumps and cumulative tonnes.
Derived at end-of-shift (see §7).
6. Assumptions
Derived from the data
- Eight
capacity = 1edges become single-lane resources; everything withcapacity = 999is unconstrained. (Fromedges.csv.) - Loader and crusher mean/sd service times. (From
loaders.csv,dump_points.csv.) - Homogeneous 100 t fleet, speed factors 1.00 / 0.85, all starting at
PARK,availability = 1.00. (Fromtrucks.csv.) - Edge free-flow time =
distance_m / (max_speed_kph × 1000 / 60). (Fromedges.csvgeometry.) - Scenario overrides (fleet size, ramp capacity/speed, ramp closure, crusher slowdown) come straight from the scenario YAML inheritance chain.
Introduced (modelling choices not dictated by the data)
- Hard shift cut at t = 480 min via
env.run(until=480). Only dumps that close strictly before 480 count — “tonnes closed at shift end”. - Routing: static shortest-time routing, computed once per scenario by Dijkstra on free-flow edge times and recomputed when a scenario closes or upgrades edges. A truck commits to its path at dispatch.
- Dispatch (dynamic loader choice): an empty truck picks the loader that
minimises
travel_to_loader + queue_len × mean_load_time + own_mean_load, wherequeue_lencounts trucks in service plus waiting; ties break by lowerloader_id. The route is static, the loader choice is dynamic. - Stochasticity: per-edge-traversal lognormal travel multiplier (mean 1,
cv = 0.10); truncated-normal load/dump times floored at
max(0.1, sample). - All trucks released simultaneously at t = 0; no warm-up.
- Reproducibility: per-replication seed =
12345 + replication_index, with independent RNG streams per stochastic source.
Limitations
- Separate ramp directions.
E03_UPandE03_DOWNare two independent single-lane resources. A genuinely shared single lane would congest worse. - Static routing. Trucks do not re-route around a queue that builds on a capacity-1 edge, so single-lane queueing is an upper bound; a smarter dispatcher could divert via the bypass.
- Boundary under-count. Productive time and tonnes accrue only on completed phases, so a phase straddling t = 480 contributes nothing — utilisation and the final partial cycle are slightly under-counted.
- Crusher never blocks downstream; no stockpile/bin back-pressure.
- Homogeneous payload; no ore blending or grade-dependent processing.
- Free-flow edges have unlimited capacity; no headway/following effects on multi-lane haul roads.
- No warm-up trimming; the empty-system start is a small (non-zero) bias.
- Node coordinates are used for visualisation only; road grade/bends beyond
distance_mandmax_speed_kphare not modelled.
7. Performance measures
Per replication (see metrics.py), then aggregated across 30 replications
with a Student-t (n − 1 = 29) 95% confidence interval (see aggregate.py):
| Measure | Definition |
|---|---|
total_tonnes_delivered | payload × completed dumps before the cut |
tonnes_per_hour | total_tonnes_delivered / 8 |
average_truck_cycle_time_min | mean completed-cycle duration (first cycle dispatch → end_dump, then end_dump → end_dump) |
average_truck_utilisation | mean over trucks of productive time / 480 |
crusher_utilisation, loader_utilisation | busy time / 480 |
average_loader_queue_time_min, average_crusher_queue_time_min | mean wait per service |
top_bottlenecks | loaders + crusher + capacity-1 edges ranked by the composite score utilisation × mean queue wait (top 5) |
The composite bottleneck score deliberately combines how busy a resource is
with how long trucks wait for it, so a resource that is occasionally used but
causes long waits (the ramp) is separated from one that is the true throughput
ceiling (the crusher). See README.md for the interpretation.
README
Synthetic Mine Throughput Simulation (Benchmark 001)
A genuine discrete-event simulation in SimPy of an 8-hour ore-haulage shift in a synthetic open-pit mine. It estimates ore throughput to the primary crusher and answers six operational decision questions about fleet size, the narrow ramp, and crusher service time.
Headline result: under the baseline 8-truck configuration the mine delivers ≈ 12,547 t/shift (1,568 t/h), 95% CI [12,491, 12,602] t, and the system is crusher-bound — not ramp-bound.
1. Installation
Python 3.11+ (developed and tested on 3.13). From this submission folder:
pip install -r requirements.txtDependencies (all from the allowed list): simpy, numpy, pandas,
scipy, matplotlib, networkx, PyYAML. pytest is needed only for the
test suite. Pillow ships transitively with matplotlib for the GIF writer.
The code is a package under src/mine_sim/. Either install it
(pip install -e .) or prefix commands with PYTHONPATH=src.
2. Running the simulation
# Produce all deliverables (7 scenarios × 30 replications) at the folder root:
PYTHONPATH=src python -m mine_sim run-all

# One scenario (quick smoke test):
PYTHONPATH=src python -m mine_sim run baseline --reps 5

# List available scenarios:
PYTHONPATH=src python -m mine_sim list

# Render topology.png + animation.gif from the event log:
PYTHONPATH=src python -m mine_sim render
run-all writes the three machine-readable artefacts — results.csv,
event_log.csv, summary.json — directly to the submission root.
Useful flags: --reps N (override replication count), --output-dir DIR,
--event-log-scope {first,all}.
Reproducing the required scenario results
PYTHONPATH=src python -m mine_sim run-all          # 30 reps each, the canonical run
PYTHONPATH=src python -m pytest -q                 # 78 focused tests
Reproducibility is exact: the per-replication seed is
base_random_seed (12345) + replication_index, drawn through independent
numpy SeedSequence streams, so any (scenario, replication) reproduces
bit-for-bit regardless of run order. event_log.csv defaults to
--event-log-scope first (replication 0 of each scenario) to stay small and
inspectable; all 30 replications feed the metrics and confidence intervals.
3. Conceptual model (summary)
Full detail is in conceptual_model.md. In brief:
- Entities: trucks (one SimPy process each); ore payload credited at dump.
- Resources (capacity-1): loaders
L_N/L_S, crusherD_CRUSH, and the 8 single-lane road segments (rampE03_*, crusher approachE05_*, pit-face roadsE07_*/E09_*). - Cycle:
PARK → choose loader → travel empty → load → travel loaded → dump → repeat, with a hard stop at t = 480 min (env.run(until=480)). - Boundary: ore only. Waste haulage, the waste dump, and the maintenance bay are out of scope (they stay in the graph but carry no traffic).
4. Main assumptions
- Hard shift cut at 480 min: only dumps that close before the cut count.
- Stochasticity: per-edge lognormal travel multiplier (mean 1, cv = 0.10);
truncated-normal load/dump times floored at
max(0.1, sample). - Homogeneous fleet: 100 t trucks, empty/loaded speed factors 1.00 / 0.85,
availability = 1.0(no breakdowns), all released at t = 0 fromPARK. - Crusher always ready (no downstream stockpile back-pressure).
- Each ramp direction is its own single lane (
E03_UP≠E03_DOWN). - 95% CIs: Student-t with 29 degrees of freedom over 30 replications.
The full split of data-derived vs introduced assumptions and limitations
is in conceptual_model.md §6.
5. Routing and dispatching logic
-
Routing — static shortest-time. One Dijkstra pass per scenario on free-flow edge times (
distance_m / (max_speed_kph × 1000 / 60)), recomputed when a scenario closes or upgrades edges. A truck commits to its path at dispatch and does not re-plan mid-leg. If any required origin- destination pair is unreachable, the model fails loudly at scenario load (aReachabilityError) rather than producing misleading numbers. -
Dispatching — dynamic nearest-available loader. Each empty truck is sent to the loader minimising
travel_to_loader + queue_len × mean_load_time + own_mean_loadwhere
queue_lencounts trucks in service plus waiting. Ties break by lowerloader_id. So the route is static, but the loader choice responds to live queues — a truck will pick the further, idle face over the nearer, busy one.
The asymmetric-ramp finding (important)
Running Dijkstra on the real graph shows that in the baseline (ramp open):
- The shortest-time
PARK → LOAD_Npath already uses the western bypass (J2 → J7 → J5), not the ramp. - Both loaded
LOAD_* → CRUSHlegs descend via E04 / E12 and never touch the ramp. - The ramp (
E03_UP) sits only onPARK → LOAD_S(the first empty leg) andE03_DOWNonly onCRUSH → PARK(the end-of-shift return).
So the ramp carries very little ore-cycle traffic. This is why upgrading or
closing it has only a small, asymmetric effect — and why the model’s behaviour
is the opposite of the naïve “narrow ramp = main bottleneck” intuition. When
the ramp is closed, the bypass keeps every face reachable
(PARK → LOAD_S reroutes J2 → J7 → J8 → J6; CRUSH → PARK via J4 → J8 → J7
→ J2).
6. Key results
30 replications per scenario, 8-hour shift. Full numbers and CIs in
summary.json; per-replication rows in results.csv.
| Scenario | Trucks | Tonnes / shift | t / h | Crusher util | Crusher queue (min) |
|---|---|---|---|---|---|
trucks_4 | 4 | 7,650 | 956 | 0.56 | 0.7 |
baseline | 8 | 12,547 | 1,568 | 0.91 | 3.3 |
trucks_12 | 12 | 12,907 | 1,613 | 0.94 | 14.2 |
ramp_upgrade | 8 | 12,607 | 1,576 | 0.92 | 3.3 |
crusher_slowdown | 8 | 6,513 | 814 | 0.95 | 26.6 |
ramp_closed | 8 | 12,363 | 1,545 | 0.90 | 3.2 |
trucks_12_ramp_upgrade | 12 | 12,953 | 1,619 | 0.94 | 14.3 |
Baseline 95% CIs: total tonnes [12,491, 12,602], t/h [1,561, 1,575].
7. Answers to the operational decision questions
-
Expected baseline throughput? ≈ 12,547 t/shift (1,568 t/h), 95% CI [12,491, 12,602] t. Truck utilisation is ~99% and crusher utilisation ~91%.
-
Likely bottlenecks? The primary crusher (
D_CRUSH) is the dominant constraint (utilisation 0.91, composite score ≈ 2.99), then loaderL_S(0.80) andL_N(0.60). The narrow ramp is not a system bottleneck — althoughE03_UPshows a long per-traversal wait (~11 min) on the rare occasions it is used, its utilisation is only ~5%, so it does not gate throughput. -
Do more trucks materially help, or does the system saturate? It saturates. Going 4 → 8 trucks adds +4,897 t (+64%), but 8 → 12 adds only +360 t (+2.9%) while the crusher queue more than quadruples (3.3 → 14.2 min). Beyond ~8 trucks the crusher is the ceiling and extra trucks mostly wait.
-
Would improving the narrow ramp materially help? No —
ramp_upgradelifts throughput by only ~+60 t (+0.5%), within noise of the baseline. The loaded legs to the crusher never use the ramp, so speeding it up barely matters. Ramp investment is not justified by throughput. -
How sensitive is throughput to crusher service time? Very. Raising mean dump time from 3.5 → 7.0 min cuts throughput from 12,547 → 6,513 t (−48%) and drives the crusher queue to ~27 min. The crusher is the binding resource, so its service rate maps almost one-for-one onto throughput.
-
Operational impact of losing the main ramp? Modest and absorbable.
ramp_closedstill delivers 12,363 t (−1.5%) because the bypass keeps every face reachable and the loaded legs never used the ramp anyway. Losing the ramp is an inconvenience for the emptyPARK → LOAD_Sleg and the end-of-shift return, not a production emergency.
Bottom line for the operator: spend on crusher capacity/throughput, not on the ramp or on a bigger truck fleet. The fleet is already near the crusher-bound knee at 8 trucks, and the ramp is a red herring.
8. Bottlenecks (how they are ranked)
Resources are ranked by a composite score utilisation × mean queue wait, which separates the throughput ceiling (high utilisation) from occasional choke points (high per-event wait). Baseline ranking:
| Rank | Resource | Kind | Utilisation | Mean queue wait | Score |
|---|---|---|---|---|---|
| 1 | D_CRUSH | crusher | 0.91 | 3.28 | 2.99 |
| 2 | L_S | loader | 0.80 | 2.45 | 1.97 |
| 3 | L_N | loader | 0.60 | 2.62 | 1.58 |
| 4 | E03_UP | edge (ramp) | 0.05 | 10.89 | 0.57 |
| 5 | E05_TO_CRUSH | edge | 0.42 | 0.15 | 0.06 |
The ramp’s high per-traversal wait but tiny utilisation (rank 4) is exactly the
asymmetric-ramp finding in numbers. Under crusher_slowdown the crusher’s
score jumps to ~25, dwarfing everything else.
9. Limitations
Summarised here, detailed in conceptual_model.md §6:
- Separate single-lane ramp directions (a truly shared lane would be worse).
- Static routing — no live re-routing around queued single-lane edges, so single-lane queueing is an upper bound.
- Boundary under-count: phases straddling t = 480 add no time/tonnes.
- No truck breakdowns;
availability = 1.0⇒ an upper-bound estimate. - Crusher never blocks downstream (no stockpile back-pressure).
- Homogeneous 100 t payload; free-flow edges have unlimited capacity; no warm-up trimming.
These mean the figures are best read as a fully-available, well-dispatched upper bound; real throughput would be somewhat lower.
10. Suggested improvements / further scenarios
- Crusher reliability: inject random short crusher outages to size the surge-pile buffer — the crusher is the binding constraint.
- Faster crusher: cut mean dump time to 2.5 min and re-run
trucks_12to value a tip upgrade (likely the highest-ROI lever). - Dynamic re-routing: re-plan when a capacity-1 edge queue exceeds a threshold, to bound the upside of a smarter dispatcher.
- Heterogeneous fleet / mid-shift loader outage: trade payload vs cycle count; size single-loader fall-back tonnes.
trucks_12_ramp_upgradeis included here as the optional 7th scenario: it shows the two investments are near-independent (12,953 t, essentiallytrucks_12plus a negligible ramp contribution) — confirming the ramp adds little even alongside a larger fleet.
11. Project layout
src/mine_sim/
  events.py         # event-log row schema (header source of truth)
  rng.py            # reproducible seeds + distributions
  scenarios.py      # YAML load + inheritance -> immutable ScenarioConfig
  topology.py       # CSV load + per-scenario immutable Topology
  routing.py        # Dijkstra routing, reachability, dispatch cost
  metrics.py        # per-replication accumulator -> ReplicationMetrics
  model.py          # the SimPy simulation (one process per truck)
  runner.py         # one-replication entry point
  scenario_runner.py# multi-rep / multi-scenario orchestration
  aggregate.py      # Student-t CIs + bottleneck ranking
  narrative.py      # assumptions / limitations / scenario text
  io_writers.py     # results.csv / event_log.csv / summary.json (flat schema)
  viz.py            # topology.png + animation.gif from model data
  cli.py            # argparse CLI: run / run-all / list / render
tests/              # 78 focused unit + integration tests
data/               # input CSVs + scenario YAMLs (incl. the 7th combo)
Outputs at the root: results.csv, summary.json, event_log.csv,
topology.png, animation.gif, plus this README.md and
conceptual_model.md.