2026-05-08__001_synthetic_mine_throughput__claude-code__claude-opus-4-7__nelson-v2-2-2-max-thinking
Date: 2026-05-08 · Benchmark: 001_synthetic_mine_throughput · Harness: claude-code · Model: claude-opus-4-7 (nelson-v2-2-2-max-thinking) · ? Unrecorded
Scores
| Category | Points | Max |
|---|---|---|
| Conceptual modelling | 19 | 20 |
| Data and topology | 14 | 15 |
| Simulation correctness | 19 | 20 |
| Experimental design | 14 | 15 |
| Results & interpretation | 14 | 15 |
| Code quality | 9 | 10 |
| Traceability | 5 | 5 |
| Total | 94 | 100 |
Run metrics
-
Total tokens:
—(method:unknown) -
Input / output tokens:
—/— - Runtime:
— s -
Reviewer model:
unknown· harness:claude-code· on2026-05-08 - Recommendation: Strong submission
- Notes: Nelson multi-agent run: complete 7-scenario deliverables, clean 10-module package, all behavioural checks pass; minor over-count in dispatch heuristic and unpopulated run_metrics/token_usage.
Source files
- README.md
- conceptual_model.md
- data/dump_points.csv
- data/edges.csv
- data/loaders.csv
- data/nodes.csv
- data/scenarios/baseline.yaml
- data/scenarios/crusher_slowdown.yaml
- data/scenarios/ramp_closed.yaml
- data/scenarios/ramp_upgrade.yaml
- data/scenarios/trucks_12.yaml
- data/scenarios/trucks_4.yaml
- data/trucks.csv
- prompt.md
- requirements.txt
- run_metrics.json
- src/mine_sim/__init__.py
- src/mine_sim/__main__.py
- src/mine_sim/data.py
- src/mine_sim/experiment.py
- src/mine_sim/routing.py
- src/mine_sim/scenarios.py
- src/mine_sim/simulation.py
- src/mine_sim/stats.py
- src/mine_sim/topology.py
- src/mine_sim/visualise.py
- submission.yaml
- summary.json
- token_usage.json
Downloads
Conceptual model
Conceptual Model — Synthetic Mine Throughput
System boundary
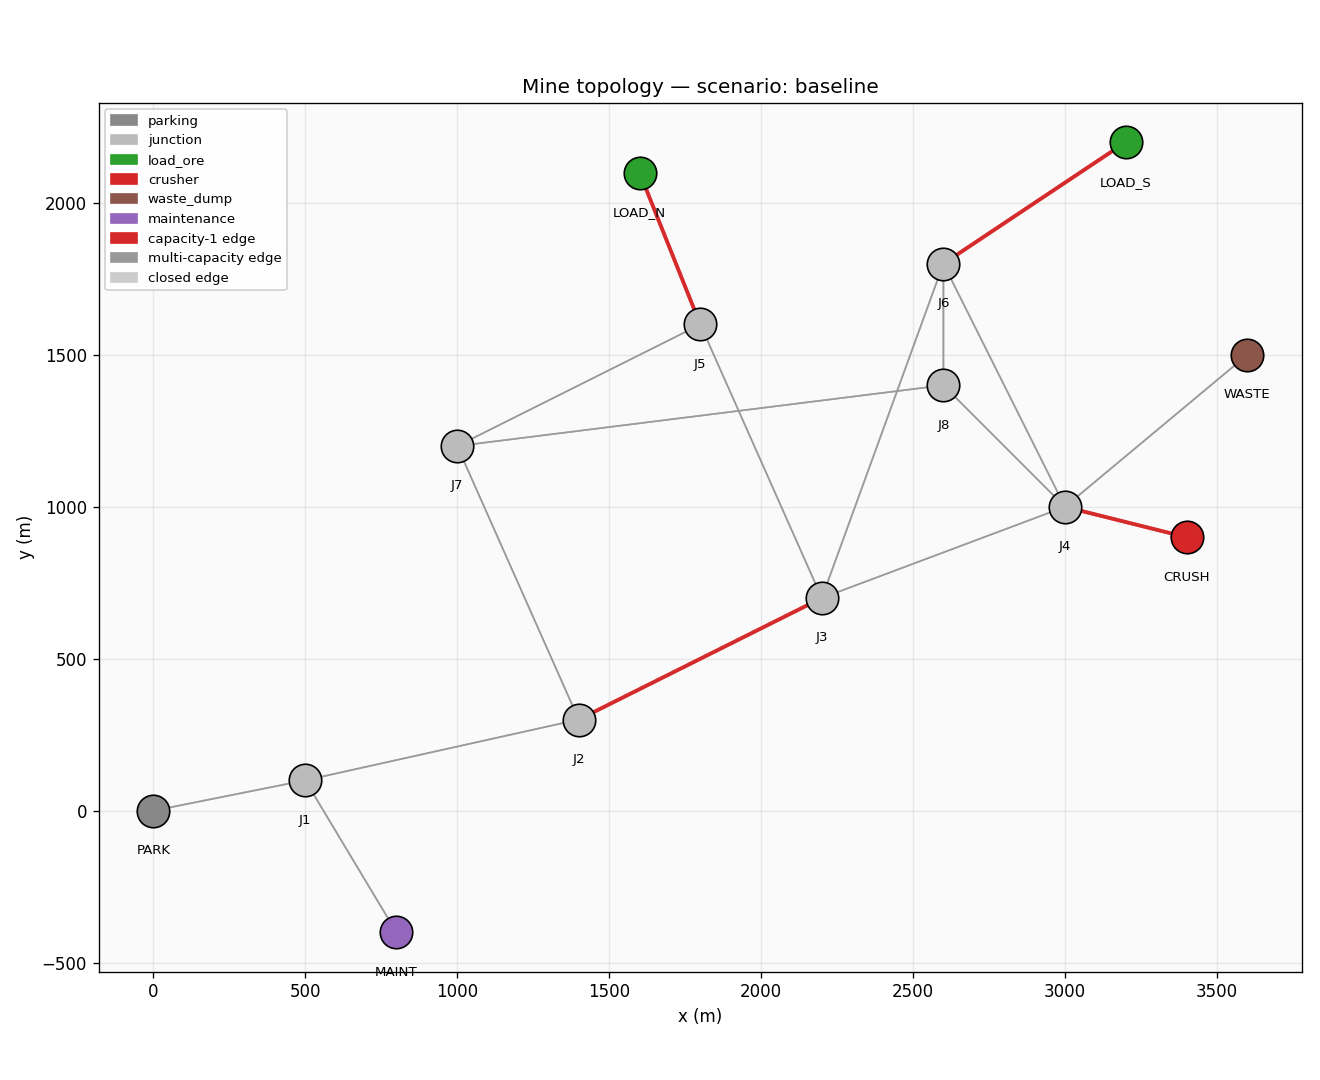
In scope. A single 8-hour ore-haulage shift on the synthetic mine topology in data/. The model represents trucks cycling between two ore loaders (LOAD_N, LOAD_S) and the primary crusher (CRUSH) over a directed road graph (junctions, ramps, haul roads, bypass). Capacity-1 road segments, loader service, and crusher service are modelled as constrained SimPy resources. All seven scenarios in data/scenarios/ are runnable.
Out of scope.
- Waste haulage (
WASTE) and maintenance (MAINT) are excluded from routing. - Truck refuelling, breakdowns, and shift changes (truck
availability= 1.0 across the data; no maintenance windows configured). - Crusher stockpile / hopper buffer; backed-up trucks queue at the crusher rather than discharging into a buffer.
- Driver behaviour heterogeneity beyond the empty / loaded speed factors.
- Multi-shift planning, energy use, and emissions.
Entities
- Trucks — active SimPy processes that loop dispatch → empty travel → load → loaded travel → dump until the shift cut. They carry the cycle state, accumulate productive minutes, and are responsible for resource requests.
- Ore payloads — implicit; tonnes are charged to the truck on
load_endand credited to the mine ondump_end(only for dumps completed at or before t = 480 min).
Resources
- Loaders (
L_N,L_S): onesimpy.Resource(capacity=1)each. Service mean / sd taken fromloaders.csv(or scenario overrides). - Crusher (
D_CRUSH): onesimpy.Resource(capacity=1)atCRUSH. Service mean / sd fromdump_points.csv(or scenario override underdump_point_overrides). - Capacity-1 directed road edges: one
simpy.Resource(capacity=1)per directed edge withcapacity == 1inedges.csv. Each direction is an independent resource (mirroring the CSV). Multi-capacity edges (capacity 999) are unconstrained — modelled as plain time delays. - Closed edges (
closed: truein scenario overrides) are absent from both the routing graph and the resource set.
Events
Per cycle, in order:
dispatched— truck departs current node with a chosen loader.enter_edge/leave_edge— once per capacity-1 edge traversed (in either direction).arrive_loader— truck reaches the loader node (queue length recorded).load_start— loader resource granted.load_end— loading service completes; truck is loaded.arrive_crusher— truck reaches the crusher node loaded.dump_start— crusher resource granted.dump_end— dumping completes; truck is empty. Throughput credited iff t ≤ 480 min.
State variables
- Per-truck: current node, loaded/empty status, current edge segment, productive minutes, loader queue minutes, crusher queue minutes, capacity-1 edge queue minutes, completed cycles, tonnes delivered, cycle times.
- Per-resource (loaders, crusher, capacity-1 edges): list of
(busy_start, busy_end)intervals and per-request queue waits. - Per-replication: total tonnes delivered, tonnes per hour, replication seed.
Routing and dispatching
- Routing. Static shortest-time routing per scenario, computed once via Dijkstra over the closure-applied directed graph. Two weight maps are precomputed: empty-leg weights (using
empty_speed_factor) and loaded-leg weights (usingloaded_speed_factor). Closures and edge overrides (capacity, max_speed_kph) propagate into routing automatically. WASTE and MAINT are stripped from the routing graph. - Dispatch rule. A truck arriving at
current_nodeand ready for a new cycle minimises:
Ties broken by enumeration order (deterministic). All trucks dispatch simultaneously at t = 0 fromcost(L) = travel_empty(current_node → loader_node(L)) + queue_len(L) × mean_load(L) + own_load_time(L) = travel_empty(...) + (queue_len(L) + 1) × mean_load(L)PARK.
Stochasticity
- Edge traversal time: lognormal noise around free-flow with coefficient of variation 0.10. Lognormal parameters are matched so the arithmetic mean equals the free-flow time:
σ²_log = ln(1 + cv²); μ_log = ln(mean) − σ²_log / 2 - Load and dump time: normal samples truncated from below at 0.1 min (
max(0.1, N(μ, σ))). Means and sds are taken from the loaders / dump_points data, with scenario overrides applied. - Per-replication seed:
seed_rep_i = base_random_seed + i. Each replication uses an independentnumpy.random.default_rng.
Performance measures
- Throughput per shift (tonnes): sum of payloads from
dump_endevents at t ≤ 480 min. - Tonnes per hour: throughput / shift hours.
- Average truck cycle time (min): mean over all completed cycles across replications.
- Truck utilisation: productive minutes (loading + dumping + edge traversal) / shift, averaged across trucks; queueing time is excluded.
- Loader / crusher utilisation: clamped busy-interval coverage of the shift.
- Average loader / crusher queue wait (min): mean wait per cycle to acquire the resource.
- Top bottlenecks: ranked by composite score =
utilisation × mean_queue_wait, computed across loaders, the crusher, and capacity-1 edges. - Uncertainty: Student-t (n-1 degrees of freedom) 95% confidence intervals on tonnes and tonnes/hour over the 30 replications.
Assumptions
Derived from the data
- Two ore loaders (one per node
LOAD_N/LOAD_S); single crusher (CRUSH). - 12 trucks defined; scenarios use a prefix of size
truck_count. - Loader and dump-point service means / sds come straight from the CSVs.
- Capacity-1 edges identified from
edges.csv(8 in baseline; 6 underramp_upgrade/ramp_closed). - Truck speed factors: empty = 1.00, loaded = 0.85.
Introduced for the model
- Hard cut at t = 480 min; dumps that complete after the cut do not count toward throughput.
- Lognormal travel-time noise with cv = 0.10 (per scenario stochasticity setting).
- Normal-truncated load / dump samples with floor 0.1 min (per scenario stochasticity setting).
- Dispatch minimises
(travel + queue_len × mean_load + own_load); ties broken deterministically. - All trucks dispatch simultaneously at t = 0 from
PARK. - One independent SimPy resource per directed capacity-1 edge (no shared bidirectional lock).
- WASTE and MAINT stripped from routing.
- Routing is static within a scenario; no live re-routing under congestion.
Limitations
- Static routing means trucks do not exploit alternate paths when their preferred path queues. A live shortest-time-with-congestion model could change findings on the bypass.
- Capacity-1 edges in opposite directions are independent resources here. If the underlying physical road is genuinely a single bidirectional lane, modelling each direction independently underestimates contention. The interview-decisions memory locks this choice (mirror CSV) and the synthetic dataset names the directions distinctly.
- Crusher buffering is absent — congestion at the crusher is modelled as truck queue rather than as an upstream stockpile.
- Initial all-trucks-at-PARK simultaneous dispatch creates a synchronous LOAD_S surge in the first cycle (one-shot artefact; see
event_log.csvreps). Steady-state behaviour dominates a 480-minute shift. - The event log retains only the first three replications per scenario to keep the file size small while still allowing visual / animation inspection. All 30 replications inform the per-rep
results.csvand the aggregatedsummary.json.
README
Synthetic Mine Throughput Simulation
Discrete-event simulation of an 8-hour ore-haulage shift on a synthetic mine topology, built with SimPy. Estimates throughput to the primary crusher across seven scenarios, with Student-t 95% confidence intervals over 30 replications each.
1. Install
python3 -m venv .venv
source .venv/bin/activate
pip install -r requirements.txt
The simulation needs simpy, numpy, pandas, scipy, networkx, pyyaml,
matplotlib, imageio, pillow. Tested on Python 3.11+.
2. Run
# Run all seven scenarios (six required + one combined) at 30 reps each.
PYTHONPATH=src python3 -m mine_sim run --data-dir data --output-dir .

# Or run a subset:
PYTHONPATH=src python3 -m mine_sim run --scenarios baseline,ramp_closed --output-dir .

# Generate the static topology image:
PYTHONPATH=src python3 -m mine_sim viz --data-dir data --output-dir . --scenario baseline

# Generate animation.gif from the existing event log (baseline rep 0):
PYTHONPATH=src python3 -m mine_sim viz --data-dir data --output-dir . --scenario baseline --animation --replication 0 --fps 8 --step-min 6.0

# Run the full pipeline end-to-end (experiment + topology + animation):
PYTHONPATH=src python3 -m mine_sim all --data-dir data --output-dir .
3. Outputs
| File | Contents |
|---|---|
results.csv | Per-replication metrics for all 7 scenarios × 30 reps. |
summary.json | Per-scenario aggregated means, 95% CIs, utilisations, top bottlenecks, plus model-wide assumptions and limitations. |
event_log.csv | Trace of dispatch, arrive/load/dump, and capacity-1 edge enter/leave events for the first three replications of each scenario (~36 k rows). |
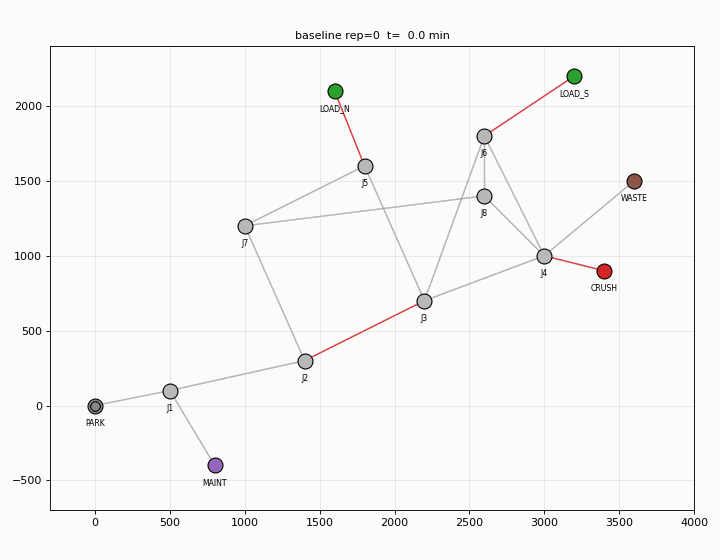
topology.png | Static plot of the directed graph; capacity-1 edges in red. |
animation.gif | Replay of baseline replication 0 truck movements. |
4. Reproducibility
- Each replication uses
seed = base_random_seed + replication_index. Thebase_random_seedis12345fromdata/scenarios/baseline.yamland is inherited by all scenarios (or override it undersimulation.base_random_seed). - A reachability self-check runs before each scenario; any closure that severs
trucks from loaders or the crusher raises a loud
RuntimeError. - All seven scenarios run in roughly 1 second on a laptop.
5. Conceptual model
See conceptual_model.md for the full system boundary,
entities, resources, events, state, and assumptions. Key design points:
- One
simpy.Resource(capacity=1)per directed capacity-1 edge — mirrorsedges.csvexactly. - Lognormal travel-time noise (
cv = 0.10) preserves the free-flow mean. - Normal-truncated load / dump samples, floored at 0.1 min.
- Hard shift cut at t = 480 min; only dumps completing within the shift count.
- Per-rep seed =
base_random_seed + rep_idx.
6. Routing and dispatching
- Routing: static shortest-time per scenario via Dijkstra on the directed graph (closures applied). Two weight maps — empty / loaded — using each truck’s speed factors (1.00 / 0.85). WASTE and MAINT nodes are stripped.
- Dispatch: a truck ready for a new cycle picks the loader minimising
travel_empty + (queue_len + 1) × mean_load. All trucks dispatch simultaneously at t = 0 fromPARK, which produces a deliberate first-cycle LOAD_S surge before steady-state balances the loaders.
7. Key results (30 reps × 8 h shift)
| Scenario | Trucks | Tonnes (95% CI) | t/h | Cycle (min) | Truck util | Crusher util | Loader util (N / S) |
|---|---|---|---|---|---|---|---|
baseline | 8 | 12,503 [12,416 – 12,590] | 1,562.9 | 29.8 | 77 % | 91 % | 0.60 / 0.80 |
trucks_4 | 4 | 7,623 [7,594 – 7,652] | 952.9 | 24.5 | 92 % | 56 % | 0.32 / 0.51 |
trucks_12 | 12 | 12,897 [12,810 – 12,983] | 1,612.1 | 42.7 | 55 % | 94 % | 0.64 / 0.85 |
ramp_upgrade | 8 | 12,557 [12,488 – 12,625] | 1,569.6 | 29.7 | 77 % | 91 % | 0.61 / 0.81 |
crusher_slowdown | 8 | 6,530 [6,455 – 6,605] | 816.2 | 55.3 | 49 % | 95 % | 0.33 / 0.44 |
ramp_closed | 8 | 12,393 [12,342 – 12,445] | 1,549.2 | 30.0 | 77 % | 90 % | 0.66 / 0.75 |
trucks_12_ramp_upgrade | 12 | 12,877 [12,790 – 12,963] | 1,609.6 | 42.7 | 54 % | 94 % | 0.64 / 0.85 |
8. Operational decisions
Q1. What is expected throughput on the baseline 8-hour shift?
~12,500 tonnes / shift (1,562 t/h). The 95% CI is [12,416, 12,590] t — a narrow band, consistent with replicated observation that the shift is constrained by a saturated crusher rather than by stochastic variation.
Q2. What are the likely bottlenecks?
The primary crusher dominates. Composite bottleneck score
(utilisation × mean_queue_wait) is the highest-ranking resource in every
balanced scenario:
| Scenario | Top bottleneck (composite) | 2nd | 3rd |
|---|---|---|---|
baseline | D_CRUSH 3.05 | L_S 1.97 | L_N 1.54 |
trucks_12 | D_CRUSH 13.36 | L_S 3.09 | L_N 1.99 |
crusher_slowdown | D_CRUSH 25.05 | E03_UP 0.58 | L_S 0.39 |
ramp_closed | L_N 3.14 | D_CRUSH 2.81 | L_S 1.65 |
The crusher is the binding constraint at 91–95% utilisation across baseline, trucks_12, and crusher_slowdown. Loader L_S (faster) is the secondary constraint; L_N is materially under-loaded in baseline.
The narrow ramp E03_UP is not a bottleneck in steady-state cycles,
because the haul roads from J5 and J6 reach the crusher junction J4
directly (via E06_FROM_NORTH + E04_TO_CRUSH and E12_TO_CRUSH) without
ever traversing the ramp. Ramp utilisation is ~5%, used only in the first
cycle for PARK → LOAD_S dispatch.
Q3. Does adding more trucks materially improve throughput?
No — the system saturates between 8 and 12 trucks. Going from 4 → 8 trucks lifts throughput +64% (7,623 → 12,503 t/shift). Going from 8 → 12 trucks adds just +3.2% (12,503 → 12,897 t/shift), while truck utilisation falls from 77% to 55% and the crusher queue wait per truck triples (3.4 → 14.4 min per cycle). Marginal benefit per added truck collapses once the crusher saturates above 90% utilisation.
Q4. Would improving the narrow ramp materially improve throughput?
No — the gain is < 1 %. ramp_upgrade lifts baseline from 12,503 →
12,557 t (+0.43%, well within the CI). The reason: the ramp is bypassed in
steady-state cycles. Loaded trucks return from the loaders to the crusher via
J5 → J3 → J4 (north) and J6 → J4 (south), neither of which uses E03_UP
or E03_DOWN. The ramp matters only for the initial PARK → LOAD_S
dispatch and is rapidly amortised. Combining ramp_upgrade with trucks_12
also produces no extra value (12,877 vs 12,897, statistically a tie).
Operator implication: capital spent on widening or speeding up the main ramp would not pay back in additional ore at the crusher under the current fleet. The capital should be directed at the crusher (faster service, or adding a second crusher / hopper buffer) and at L_S (the busier loader).
Q5. How sensitive is throughput to crusher service time?
Highly sensitive — it scales nearly inversely. Doubling the crusher’s
mean dump time from 3.5 → 7.0 min (crusher_slowdown) cuts throughput
by 48% (12,503 → 6,530 t/shift). The crusher queue per cycle balloons from
3.4 to 26.9 min, while loader queues fall (because trucks now spend their
time queued at the crusher, not at the loaders). Truck utilisation drops to
49%. Investments that shave service time at the crusher have direct
near-linear throughput payoff.
Q6. What is the operational impact of losing the main ramp route?
Very small in steady state — about 1 %. ramp_closed reroutes the
PARK → LOAD_S first dispatch via the longer western bypass (PARK → J1 → J2
→ J7 → J8 → J6 → LOAD_S, +2.6 min loaded). Throughput drops 12,503 →
12,393 t/shift (-0.9%). Loader L_N picks up share (utilisation 0.60 → 0.66)
because trucks initially routed to LOAD_S see the longer alternative path
and the dispatch rule occasionally prefers L_N. The mine can safely operate
without the main ramp; closing it for maintenance would barely move the
production needle, contradicting the intuition that a “narrow ramp” implies
a meaningful constraint.
Additional scenario: trucks_12_ramp_upgrade
This combination tests whether the ramp upgrade releases value once trucks
are abundant. It does not — throughput tracks trucks_12 exactly (12,877
vs 12,897 t, statistically indistinguishable), confirming that the crusher
remains the binding constraint regardless of upstream haul-road improvements.
9. Bottleneck summary
| Resource | Role | Note |
|---|---|---|
Crusher (D_CRUSH) | Primary | 91–95% util in all balanced scenarios; near-linear sensitivity to service time. |
| Loader L_S | Secondary | Faster service (4.5 vs 6.5 min) means the dispatch rule prefers it; util ≈ 80 %. |
| Loader L_N | Reserve | Util 60 % in baseline; absorbs traffic when alternatives queue up (e.g. ramp_closed). |
Ramp E03_UP/DOWN | Non-binding | Bypassed in steady state; ~5 % util. |
Pit roads E07, E09 | Non-binding | Single-lane, but cycle frequency keeps utilisation < 50 %. |
10. Limitations
- Static routing. Trucks do not adapt to live congestion; a re-routing policy could lift throughput modestly when capacity-1 edges queue.
- Independent directional resources. The CSV defines each direction of a capacity-1 edge as a separate resource. If the physical road is in fact a single bidirectional lane, this model under-estimates contention.
- No crusher buffer / stockpile. Backed-up trucks queue at the crusher rather than emptying into a hopper; this is conservative for throughput estimates when the crusher saturates.
- Truck availability = 1.0. No breakdowns, refuelling, or shift changes.
- Simultaneous t = 0 dispatch creates a synchronous LOAD_S surge in the first cycle that is visible in the event log; steady-state metrics dominate the 480-minute window.
- Event log retains 3 reps per scenario to keep the file small (~36 k
rows). All 30 replications inform
results.csvandsummary.json.
11. Suggested improvements
- Crusher capacity: add a second crusher line, an upstream hopper, or invest in faster discharge. Sensitivity analysis suggests near-linear payback up to roughly 8 trucks worth of feed.
- Dynamic routing: recompute shortest-time on the fly using current queue lengths. Likely most impactful when trucks are abundant.
- Truck availability modelling: scenarios with realistic
availability< 1.0 and breakdown distributions to stress-test the production target. - Loader rebalancing: the dispatch rule already biases toward the faster loader; an enforced floor on L_N usage might smooth queueing.
- Bidirectional capacity-1 lanes as a single resource where the physical road is one lane in reality.
12. Project layout
.
├── data/                             # Static inputs (provided)
├── src/mine_sim/
│   ├── __init__.py
│   ├── __main__.py                   # CLI: run / viz / all / list-scenarios
│   ├── data.py                       # Typed CSV loaders
│   ├── scenarios.py                  # YAML scenario loader + inheritance + combo
│   ├── topology.py                   # Override-applied DiGraph + reachability check
│   ├── routing.py                    # Static shortest-time + dispatch rule
│   ├── simulation.py                 # SimPy DES core (one rep)
│   ├── stats.py                      # Student-t CI + utilisation helpers
│   ├── experiment.py                 # Multi-rep runner + summary aggregation
│   └── visualise.py                  # topology.png + animation.gif
├── conceptual_model.md
├── README.md                         # this file
├── results.csv
├── summary.json
├── event_log.csv
├── topology.png
└── animation.gif