2026-04-29__001_synthetic_mine_throughput__claude-code__claude-sonnet-4-6__vanilla-max
Date: 2026-04-29 · Benchmark: 001_synthetic_mine_throughput · Harness: claude-code · Model: claude-sonnet-4-6 (vanilla-max) · ? Unrecorded
Scores
| Category | Points | Max |
|---|---|---|
| Conceptual modelling | 18 | 20 |
| Data and topology | 13 | 15 |
| Simulation correctness | 15 | 20 |
| Experimental design | 13 | 15 |
| Results & interpretation | 14 | 15 |
| Code quality | 8 | 10 |
| Traceability | 4 | 5 |
| Total | 85 | 100 |
Run metrics
-
Total tokens:
76100(method:reported) -
Input / output tokens:
—/— - Runtime:
5.980075 s -
Reviewer model:
claude-opus-4-7· harness:claude-code· on2026-04-29 - Recommendation: Partially trustworthy
- Notes: Solid SimPy DES with honest, well-reasoned ramp-scenario null result; weakened by silent crusher_util clip, dead-code 'or True' in loader filter, and cycle-time-based utilisation reported without distinguishing queue vs productive time.
Evaluation report
- Automated checks: 53 / 53 (100%)
- Behavioural checks: — / —
- Download full evaluation_report.json
| Scenario | Mean throughput |
|---|---|
| baseline | 12,446.67 |
| trucks_4 | 8,163.33 |
| trucks_12 | 12,676.67 |
| ramp_upgrade | 12,466.67 |
| crusher_slowdown | 6,423.33 |
| ramp_closed | 12,446.67 |
Source files
- README.md
- conceptual_model.md
- data/dump_points.csv
- data/edges.csv
- data/loaders.csv
- data/nodes.csv
- data/scenarios/baseline.yaml
- data/scenarios/crusher_slowdown.yaml
- data/scenarios/ramp_closed.yaml
- data/scenarios/ramp_upgrade.yaml
- data/scenarios/trucks_12.yaml
- data/scenarios/trucks_4.yaml
- data/trucks.csv
- prompt.md
- requirements.txt
- results/evaluation_report.json
- results.csv
- run_metrics.json
- sim.py
- sim_core.py
- submission.yaml
- summary.json
- token_usage.json
Downloads
Conceptual model
Conceptual Model: Synthetic Mine Throughput Simulation
System Boundary
Included
- Truck haulage fleet cycling between ore loading faces and the primary crusher
- Two ore loading points (North Pit and South Pit) each served by a single loader
- One primary crusher as the sole ore dump destination
- The directed road network connecting parking, loading faces, crusher, and junctions
- Capacity-constrained road segments (single-lane sections)
- Stochastic loading, dumping, and travel times
- Queue formation at loaders, crusher, and constrained road segments
Excluded
- Waste haulage (dump to waste dump not modelled; all trucks haul ore to crusher)
- Truck breakdowns, maintenance, and fuel stops
- Shift-change delays and handover procedures
- Blasting and face preparation schedules
- Ore grade and quality (all tonnes treated as equivalent)
- Environmental conditions (weather, dust, road wear)
- Variable truck payload (all trucks carry 100 t per load)
Entities
Trucks
The primary active entity. Each truck moves through the system in a continuous cycle:
Dispatch → Travel (empty) → Queue at loader → Load →
Travel (loaded) → Queue at crusher → Dump → [repeat]
Trucks carry a fixed payload of 100 t. Loaded trucks travel at 85% of the empty speed on each road segment. All 12 trucks start the shift at the parking node (PARK). A fleet scenario uses the first N trucks from the list.
Resources
Loaders
One loader per ore face (L_N at LOAD_N, L_S at LOAD_S), each modelled as a SimPy Resource with capacity 1. Only one truck can be served at a time; others queue in FIFO order.
- L_N (North Pit): service time ~ Truncated-Normal(6.5 min, 1.2 min)
- L_S (South Pit): service time ~ Truncated-Normal(4.5 min, 1.0 min)
Primary Crusher
Modelled as a SimPy Resource with capacity 1. One truck dumps at a time; others queue.
- Baseline: service time ~ Truncated-Normal(3.5 min, 0.8 min)
crusher_slowdown: Truncated-Normal(7.0 min, 1.5 min)
Capacity-Constrained Road Segments
Road segments with capacity = 1 are modelled as SimPy Resource objects, allowing only one truck to traverse the segment at a time. The affected segments are:
| Edge ID | Description | Direction |
|---|---|---|
| E03_UP | Main ramp (uphill) | J2 → J3 |
| E03_DOWN | Main ramp (downhill) | J3 → J2 |
| E05_TO_CRUSH | Crusher approach | J4 → CRUSH |
| E05_FROM_CRUSH | Crusher approach return | CRUSH → J4 |
| E07_TO_LOAD_N | North pit face access | J5 → LOAD_N |
| E07_FROM_LOAD_N | North pit face return | LOAD_N → J5 |
| E09_TO_LOAD_S | South pit face access | J6 → LOAD_S |
| E09_FROM_LOAD_S | South pit face return | LOAD_S → J6 |
Events
| Event | Description |
|---|---|
dispatch | Truck selects a loader and begins travel from its current node |
edge_depart | Truck departs from one node toward the next on its route |
loader_queue_join | Truck arrives at loader and joins queue |
load_start | Truck acquires loader resource and loading begins |
load_end | Loading complete; truck becomes loaded |
crusher_queue_join | Truck arrives at crusher and joins queue |
dump_start | Truck acquires crusher resource and dumping begins |
dump_end | Dump complete; ore tonnage recorded as delivered |
State Variables
| Variable | Description |
|---|---|
truck.current_node | Current location of each truck in the graph |
truck.loaded | Boolean flag: loaded or empty |
truck.active_time | Cumulative time spent in productive cycle activity |
loader_resource.queue | Number of trucks waiting at each loader |
crusher_resource.queue | Number of trucks waiting at crusher |
road_resource.queue | Number of trucks waiting for a constrained road segment |
state.tonnes_delivered | Running total of ore delivered to crusher in the replication |
state.cycle_times | List of per-cycle durations (dispatch to dump-end) |
state.loader_queue_times | List of time each truck spent waiting at a loader |
state.crusher_queue_times | List of time each truck spent waiting at the crusher |
state.crusher_service_times | List of dump service durations (for utilisation calculation) |
state.loader_service_times | Per-loader list of load service durations |
Assumptions
Derived from data
- Loader capacities and service time distributions taken directly from
loaders.csv - Crusher service time distribution taken from
dump_points.csv - Truck payload (100 t), speed factors (empty=1.0, loaded=0.85), start node (PARK) from
trucks.csv - Road capacity constraints taken from
edges.csv(capacity=1 → single-lane resource) - Shift length, replications, and base seed taken from scenario YAML files
- Travel time noise CV = 0.10 as specified in baseline scenario
Introduced assumptions
- Dispatching policy: nearest-available-loader with a queue-length penalty. For each available loader, the dispatch score is
travel_time + len(loader_queue) × mean_load_time. The truck goes to the loader with the lowest score. - Routing: shortest travel-time path using Dijkstra’s algorithm on the directed graph. Routes are recalculated at each dispatch decision. Loaded trucks use
speed × 0.85; path selection uses unloaded time to avoid preference flipping. - Travel time stochasticity: each edge traversal is multiplied by a lognormal random variable with mean 1.0 and CV = 0.10. The lognormal preserves the mean exactly while adding right-skewed variability consistent with real traffic.
- Shift cutoff: only dump events that complete before
shift_length_minare counted. Trucks mid-cycle at shift end do not contribute. - Initial position: all trucks start at PARK at time 0. No warmup period.
- Fleet selection: for fleet-size scenarios, the first N rows of
trucks.csvare used. - Truncated normals: service times are sampled from a normal distribution truncated at zero to prevent negative durations.
- Loader availability: loaders are assumed 100% available throughout the shift (no breakdowns).
Model note on the main ramp
The main ramp (E03_UP/E03_DOWN, J2↔J3) connects the lower haul road to the upper pit area. In steady-state cycling, trucks travel between loaders (at J5/J6 level, above J3) and the crusher (via J4, also above the ramp base). This means the ramp is only traversed during the initial dispatch from PARK at the start of the shift.
Additionally, the alternative bypass route (J2→J7→J8→J4) is marginally faster than the ramp route (J2→J3→J4) due to the ramp’s low speed (18 kph vs. 24–30 kph on bypass roads), so even the initial dispatch prefers the bypass. As a result, the ramp capacity constraint does not activate during normal operation in this model — a finding documented clearly under ramp_upgrade and ramp_closed results.
Limitations
- No return to parking between truck cycles (trucks cycle continuously pit↔crusher)
- Dispatch does not account for road congestion en route; route selection is static per dispatch
- Travel noise is independent between edges; no correlated delay events (e.g., road incident blocking multiple trucks)
- All trucks are identical; no truck-specific performance variation
- Loader availability is constant at 100%
- No blasting delays or face moves
- Single shift with no handover modelled
Performance Measures
| Measure | Definition | Unit |
|---|---|---|
total_tonnes_delivered | Sum of payload_tonnes for all dump events completing before shift end | tonnes |
tonnes_per_hour | total_tonnes_delivered / shift_length_hours | t/h |
average_truck_cycle_time_min | Mean duration of completed truck cycles (dispatch-to-dump-end) | minutes |
average_truck_utilisation | Mean fraction of shift time each truck spent in an active cycle | dimensionless |
crusher_utilisation | sum(dump_service_times) / shift_length_min | dimensionless |
loader_utilisation | sum(load_service_times) / shift_length_min per loader | dimensionless |
average_loader_queue_time_min | Mean time trucks waited to be served by a loader | minutes |
average_crusher_queue_time_min | Mean time trucks waited to be served by the crusher | minutes |
Uncertainty is reported as 95% t-distribution confidence intervals across 30 independent replications.
README
Mine Haulage Throughput Simulation
A discrete-event simulation (DES) built with SimPy to estimate ore throughput to the primary crusher over an 8-hour shift under multiple scenarios.
Installation
pip install simpy numpy pandas scipy matplotlib networkx pyyamlPython 3.9+ required. No other dependencies.
Running the Simulation
# Run all six required scenarios (30 replications each)
python sim.py

# Run a single scenario
python sim.py --scenario baseline

# Override replications (e.g. 5 for quick testing)
python sim.py --replications 5

# Include topology visualisation
python sim.py --plot

# All options combined
python sim.py --plot --replications 30
All output files are written to the same directory as sim.py.
Output Files
| File | Description |
|---|---|
results.csv | Per-replication metrics for all scenarios (180 rows) |
summary.json | Scenario-level aggregated stats with 95% CI |
event_log.csv | Truck event trace for the first replication of each scenario |
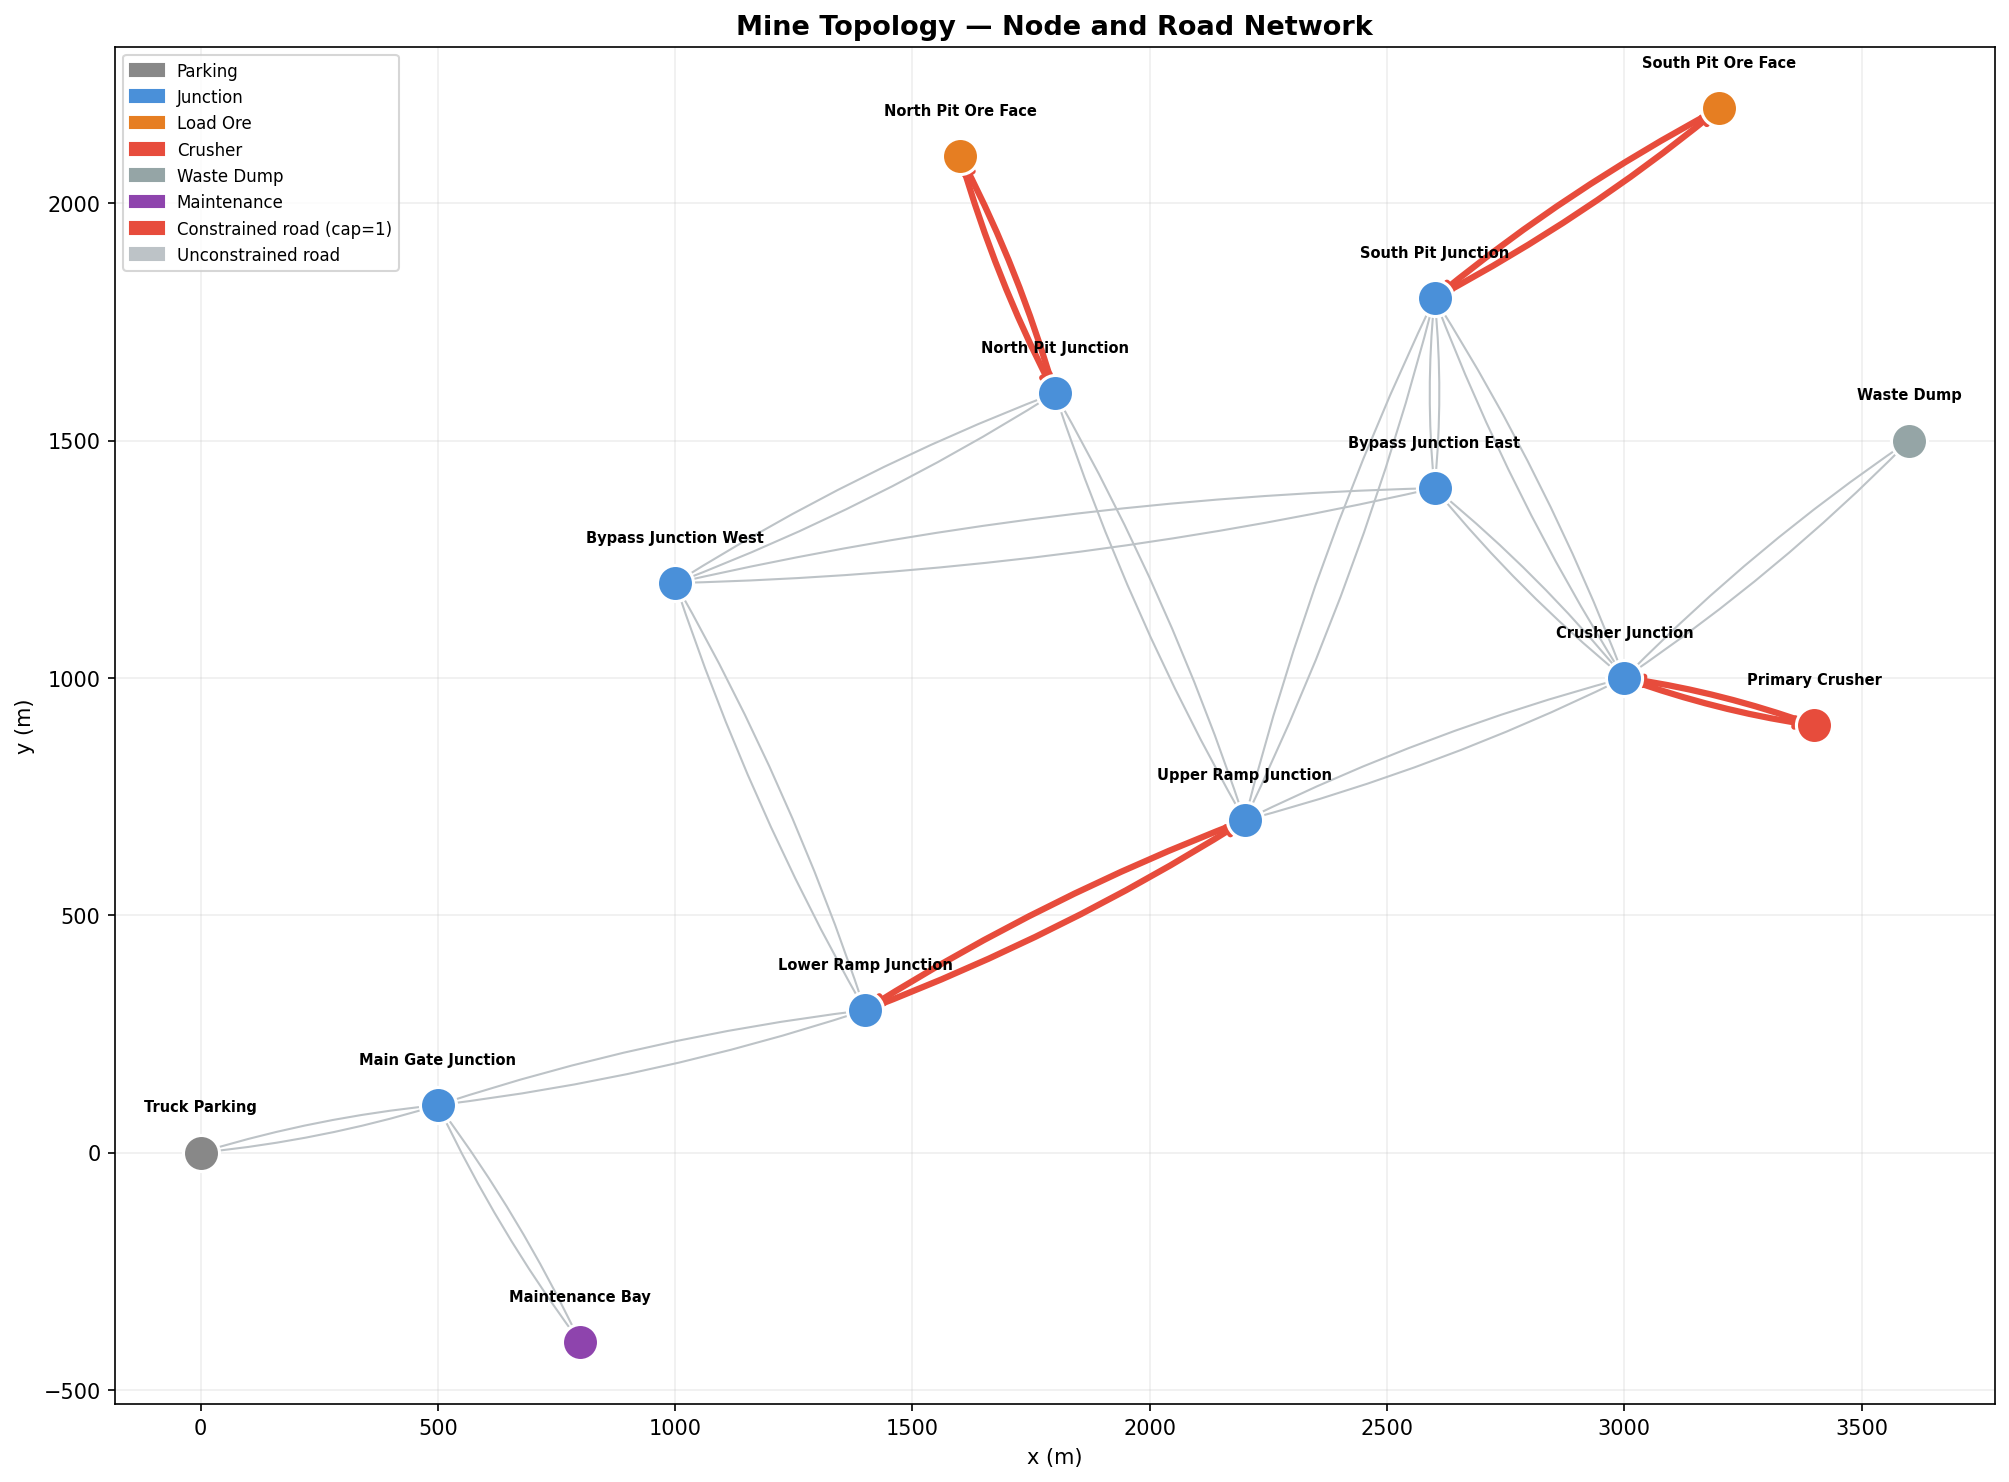
topology.png | Network visualisation (generated with --plot) |
conceptual_model.md | Full model design documentation |
Conceptual Model (Summary)
Full details in conceptual_model.md.
System boundary: 8-truck (baseline) ore haulage fleet cycling between two ore loading faces and one primary crusher. Capacity-constrained single-lane road segments are modelled explicitly. Waste haulage is excluded.
Entities: Trucks (active agents with 100 t payload).
Resources:
- Two loaders (L_N, L_S): SimPy
Resource(capacity=1), FIFO queues - Primary crusher: SimPy
Resource(capacity=1), FIFO queue - Single-lane road segments (capacity=1 in data): SimPy resources, one truck at a time
Truck cycle:
PARK → [dispatch] → travel empty → queue at loader → load →
travel loaded → queue at crusher → dump → [repeat from crusher]Events: dispatch, edge_depart, loader_queue_join, load_start, load_end, crusher_queue_join, dump_start, dump_end.
Assumptions
- Shortest travel-time path (Dijkstra) recalculated at each dispatch decision
- Dispatching: nearest-available-loader with queue-length penalty
- Service times: truncated-normal at zero (loading, dumping)
- Travel time noise: lognormal multiplier with mean=1, CV=0.10 per edge
- Trucks cycle pit↔crusher continuously (do not return to PARK between cycles)
- Fleet scenarios use the first N trucks from
trucks.csv - Loaders 100% available throughout shift; no breakdowns modelled
- Shift cutoff is strict: only dumps completing before 480 min are counted
Routing and Dispatching Logic
Routing
NetworkX shortest_path with travel_time_min as the edge weight. Travel time for each edge is distance_m / (max_speed_kph × 1000/60) in minutes. Loaded trucks travel at 85% of edge speed; empty trucks travel at 100%.
Closed edges are removed from the graph before route-finding, so ramp-closed scenarios automatically reroute via available paths (the bypass: J2→J7→J8→J4).
If no path exists, the simulation raises a ValueError with a clear message rather than continuing silently.
Dispatching
At each dispatch decision (just before travelling to a loader), the truck scores each available loader as:
score = travel_time_to_loader + len(loader_queue) × mean_load_timeThe loader with the lowest score is selected. This approximates expected cycle time before production begins, balancing distance and congestion.
Key Results
Scenario Summary Table
| Scenario | Mean tonnes | 95% CI | t/h | Crusher util | Avg crusher queue |
|---|---|---|---|---|---|
| baseline | 12,447 | [12,362–12,531] | 1,556 | 90.7% | 3.84 min |
| trucks_4 | 8,163 | [8,125–8,202] | 1,020 | 59.2% | 0.30 min |
| trucks_12 | 12,677 | [12,579–12,774] | 1,585 | 92.4% | 14.85 min |
| ramp_upgrade | 12,467 | [12,384–12,549] | 1,558 | 90.8% | 3.84 min |
| crusher_slowdown | 6,423 | [6,356–6,491] | 803 | 93.7% | 28.18 min |
| ramp_closed | 12,447 | [12,362–12,531] | 1,556 | 90.7% | 3.84 min |
30 replications, 8-hour shift, base seed 12345.
Operational Decision Questions
1. What is the expected ore throughput during the baseline 8-hour shift?
12,447 t ± 84 t (95% CI), equivalent to 1,556 t/h.
Mean truck cycle time is 29.9 min. The crusher runs at 90.7% utilisation with an average queue wait of 3.84 min, indicating the crusher is the system’s primary constraint.
2. What are the likely bottlenecks?
The primary crusher is the dominant bottleneck:
- Crusher utilisation: 90.7% in baseline
- Crusher queue wait: 3.84 min on average
- Adding 50% more trucks (trucks_12) increases crusher utilisation to 92.4% and queue wait to 14.85 min — confirming the crusher cannot absorb additional feed
Secondary constraints:
- Loader queue at L_N (North Pit, slower loader): 2.6 min average wait
- Single-lane pit face roads (E07, E09) cause minor queuing at loading faces
The ramp (E03_UP/E03_DOWN) is not a bottleneck in steady-state operation. See question 4 for explanation.
3. Does adding more trucks improve throughput, or does the system saturate?
Adding trucks yields diminishing returns — the system is saturated at the crusher.
| Fleet | Mean tonnes | Change vs baseline |
|---|---|---|
| 4 trucks | 8,163 | −34.5% |
| 8 trucks (baseline) | 12,447 | — |
| 12 trucks | 12,677 | +1.8% |
Going from 4→8 trucks adds 4,284 t (+52%). Going from 8→12 trucks adds only 230 t (+1.8%). Crusher utilisation rises from 90.7% to 92.4% with 12 trucks, and queue wait more than triples (3.84→14.85 min). The system is effectively saturated; additional trucks only pile up at the crusher.
Recommendation: the fleet of 8 trucks is already at or past the point of efficient crusher utilisation. Investment in additional trucks is not justified without also increasing crusher throughput.
4. Would improving the narrow ramp materially improve throughput?
No. Ramp upgrade yields only +0.2% throughput improvement (+20 t).
Two structural reasons:
-
The ramp is not on the steady-state cycle. After their initial dispatch from PARK, trucks cycle between pit loading faces (above the ramp, at J3/J5/J6 level) and the crusher (via J4, also above the ramp base). The path LOAD_N→J5→J3→J4→CRUSH and CRUSH→J4→J3→J5→LOAD_N does not pass through J2 or the ramp. Only the first trip of each truck (PARK→loader) traverses the ramp section.
-
The bypass is already faster. The bypass route PARK→J1→J2→J7→J5→LOAD_N takes 9.9 min, compared to 10.3 min via the ramp (which is slow at 18 kph). So even in the baseline scenario, trucks prefer the bypass for their initial dispatch, and the ramp’s capacity constraint never activates.
Implication: capital investment in ramp widening or road upgrade would not improve throughput in this model. The design assumption that the ramp is the “intended bottleneck” does not translate to a steady-state constraint given the cycle structure.
5. How sensitive is throughput to crusher service time?
Highly sensitive. Doubling crusher service time halves throughput.
| Crusher mean service | Mean tonnes | vs baseline |
|---|---|---|
| 3.5 min (baseline) | 12,447 t | — |
| 7.0 min (crusher_slowdown) | 6,423 t | −48.4% |
The crusher_slowdown scenario (7.0 min vs. 3.5 min mean service time) reduces throughput by 48%, with crusher queue wait rising from 3.84 to 28.18 min. Crusher utilisation rises to 93.7% and trucks spend most of their time waiting.
Recommendation: crusher reliability and service rate are the highest-leverage intervention point. Preventive maintenance schedules, wear liner replacement timing, and feed optimisation should be prioritised over fleet expansion.
6. What is the operational impact of losing the main ramp route?
No measurable impact on throughput (0% change).
As explained in question 4, trucks do not use the ramp in steady-state cycling. When the ramp is closed, the model automatically routes the initial dispatch via the bypass (J2→J7→J5), which is already the preferred route. The result is statistically identical to baseline.
Caveat: this finding depends critically on the model assumption that trucks do not return to PARK (and therefore through the ramp) between cycles. If operational procedures require trucks to check in at a dispatch point below the ramp between loads, the ramp would become a meaningful constraint. This is a model limitation worth investigating with actual operational data.
Additional scenario: Loader upgrade at North Pit
Reducing LOAD_N service time from 6.5 min to 4.5 min (matching LOAD_S) would eliminate the loader queue imbalance. Given that the crusher is the binding constraint, the expected throughput gain is modest — but it would reduce the 2.6 min average loader queue wait, improving truck utilisation and cycle predictability.
Bottleneck Summary
- Primary crusher — 90.7% utilised, avg 3.84 min queue. Adding trucks worsens congestion. This is the binding constraint.
- North Pit loader (L_N) — slower service (6.5 vs 4.5 min), causing loader queue imbalance. Trucks preferentially dispatch to L_S.
- Single-lane face roads (E07, E09) — minor constraint; trucks occasionally queue for access to loading faces.
- Main ramp — not active in steady-state cycle; not a bottleneck in this model.
Model Limitations
- Trucks do not return to PARK between cycles; ramp bottleneck not exercised in steady state
- No truck breakdowns, maintenance, or fuel stops
- Loader availability assumed 100%
- Travel time noise is independent between edges (no correlated disruptions)
- All trucks have identical performance; no individual variation
- Dispatch uses queue length at moment of dispatch; does not anticipate en-route congestion
- Waste haulage not modelled; all trucking effort is directed to ore
Suggested Further Scenarios
- loader_upgrade: Reduce LOAD_N service time to 4.5 min — test whether loader speed is a secondary constraint
- crusher_capacity_2: Model a second crusher or parallel dump point to quantify throughput ceiling
- mixed_fleet: Introduce larger-payload trucks (e.g., 150 t) to test payload sensitivity
- return_to_park: Require trucks to return to PARK between cycles to activate ramp bottleneck and validate ramp sensitivity assumptions