2026-04-29__001_synthetic_mine_throughput__claude-code__claude-opus-4-7__agent-teams-nelson-max-thinking
Date: 2026-04-29 · Benchmark: 001_synthetic_mine_throughput · Harness: claude-code · Model: claude-opus-4-7 (agent-teams-nelson-max-thinking) · ? Unrecorded
Scores
| Category | Points | Max |
|---|---|---|
| Conceptual modelling | 19 | 20 |
| Data and topology | 15 | 15 |
| Simulation correctness | 19 | 20 |
| Experimental design | 14 | 15 |
| Results & interpretation | 14 | 15 |
| Code quality | 9 | 10 |
| Traceability | 5 | 5 |
| Total | 95 | 100 |
Run metrics
-
Total tokens:
—(method:unknown) -
Input / output tokens:
—/— - Runtime:
— s -
Reviewer model:
unknown· harness:claude-code· on2026-04-29 - Recommendation: Strong submission
- Notes: Clean SimPy DES with rigorous warmup-aware metrics and full event-log auditability; Nelson red-cell review correctly flagged a dead module-level dict that wasn't removed before submission, plus the unused PriorityResource priority parameter.
Evaluation report
- Automated checks: 53 / 53 (100%)
- Behavioural checks: — / —
- Download full evaluation_report.json
| Scenario | Mean throughput |
|---|---|
| baseline | 12,960 |
| trucks_4 | 7,813.333 |
| trucks_12 | 12,996.667 |
| ramp_upgrade | 13,033.333 |
| crusher_slowdown | 6,560 |
| ramp_closed | 12,883.333 |
Source files
- README.md
- conceptual_model.md
- data/dump_points.csv
- data/edges.csv
- data/loaders.csv
- data/nodes.csv
- data/scenarios/baseline.yaml
- data/scenarios/crusher_slowdown.yaml
- data/scenarios/ramp_closed.yaml
- data/scenarios/ramp_upgrade.yaml
- data/scenarios/trucks_12.yaml
- data/scenarios/trucks_4.yaml
- data/trucks.csv
- prompt.md
- requirements.txt
- results/evaluation_report.json
- run.py
- src/__init__.py
- src/metrics.py
- src/run_experiments.py
- src/scenario.py
- src/simulation.py
- src/topology.py
- submission.yaml
- summary.json
Downloads
Conceptual model
Conceptual Model: Synthetic Mine Throughput Simulation
This document describes the conceptual model underlying the discrete-event simulation (DES) of a synthetic open-pit mine haulage system. The simulation is built with SimPy and is designed to answer six operational decision questions about mine throughput under varying fleet sizes, road configurations, and crusher conditions.
System Boundary
Included in the model:
- Truck fleet operating over an 8-hour shift
- Road network connecting parking, loading points, the crusher, and bypass routes
- Two ore loading points (North Pit and South Pit faces)
- One primary crusher (dump destination)
- Capacity-constrained road segments that limit simultaneous truck occupancy
- Stochastic loading, dumping, and travel times
- Dispatcher that assigns trucks to loaders and routes them via shortest-time paths
Excluded from the model:
- Equipment breakdowns and unplanned downtime
- Shift changes and crew availability
- Fuel consumption, tyre wear, and maintenance schedules
- Weather and ground condition variability
- Ore grade and blending requirements
- Blast cycles and face advance
- Waste haulage (trucks run ore-to-crusher cycles only)
- Multi-payload trucks (each truck carries a single 100-tonne bucket per cycle)
Entities
Trucks are the only active entities. Each truck is characterised by:
truck_id— unique identifierpayload_tonnes— 100 t per truckempty_speed_factor— 1.00 (full road speed when empty)loaded_speed_factor— 0.85 (15 % speed reduction when carrying ore)start_node— PARK (all trucks begin at the parking area)
Ore payloads are not modelled as separate entities; a loaded truck implicitly carries 100 tonnes and delivers them when it completes a dump cycle.
Resources
Resources limit simultaneous access and cause queuing when saturated.
| Resource | Node / Edge | Capacity | Notes |
|---|---|---|---|
| Loader North | LOAD_N | 1 | Mean load time 6.5 min, SD 1.2 min |
| Loader South | LOAD_S | 1 | Mean load time 4.5 min, SD 1.0 min |
| Crusher | CRUSH | 1 | Mean dump time 3.5 min, SD 0.8 min |
| Ramp outbound | E03_UP (J2→J3) | 1 | Narrow uphill ramp; primary bottleneck |
| Ramp inbound | E03_DOWN (J3→J2) | 1 | Same physical constraint, separate edge |
| Crusher approach outbound | E05_TO_CRUSH (J4→CRUSH) | 1 | Single-lane dump approach |
| Crusher approach inbound | E05_FROM_CRUSH (CRUSH→J4) | 1 | Single-lane return |
| North pit face access outbound | E07_TO_LOAD_N (J5→LOAD_N) | 1 | Single-lane face road |
| North pit face access inbound | E07_FROM_LOAD_N (LOAD_N→J5) | 1 | Single-lane face road |
| South pit face access outbound | E09_TO_LOAD_S (J6→LOAD_S) | 1 | Single-lane face road |
| South pit face access inbound | E09_FROM_LOAD_S (LOAD_S→J6) | 1 | Single-lane face road |
All edges with capacity < 999 are wrapped as SimPy Resource objects with that capacity.
Edges with capacity = 999 are treated as unconstrained (trucks travel freely after a
travel-time delay).
Events
Each truck cycles through the following events repeatedly until the shift ends:
- Truck dispatched — Dispatcher assigns a truck (at PARK or returning from crusher) to an available loader or the loader with the shortest expected wait.
- Truck departs toward loader — Truck acquires capacity on each road segment in sequence along the shortest-time path.
- Truck arrives at loader queue — Truck requests the loader resource.
- Loading starts — Loader resource granted; loading time sampled from truncated normal.
- Loading ends — Truck now carries 100 t; loader resource released.
- Truck departs toward crusher — Truck travels loaded at 85 % of road speed, acquiring segment resources along the route.
- Truck arrives at crusher queue — Truck requests the crusher resource.
- Dumping starts — Crusher resource granted; dump time sampled from truncated normal.
- Dumping ends — Truck delivers 100 t to the crusher; crusher resource released; tonnes_delivered counter incremented.
- Truck returns empty — Truck travels empty back to PARK (or is immediately re-dispatched if a loader is waiting).
- Shift end — At
shift_length_hours * 3600simulation seconds, in-flight cycles are counted if the truck has already completed loading (ore is already in transit); cycles not yet loaded are abandoned.
State Variables
| Variable | Description |
|---|---|
truck.location | Current node or edge of each truck |
truck.loaded | Boolean — whether the truck is carrying ore |
truck.assigned_loader | Loader currently assigned to this truck (None when idle) |
queue_length[resource] | Number of trucks waiting for each loader/crusher/road segment |
resource_busy_time[resource] | Cumulative seconds each resource has been in use |
tonnes_delivered | Running total of ore (tonnes) dumped at the crusher per replication |
cycle_times | List of full cycle durations (dispatch → dump end) per truck per replication |
| `truck_wait_time[loader | crusher]` |
Assumptions
Derived from Data
- Loader service times are normally distributed with parameters from
loaders.csv(L_N: mean 6.5 min, SD 1.2 min; L_S: mean 4.5 min, SD 1.0 min). - Crusher dump times are normally distributed (mean 3.5 min, SD 0.8 min) from
dump_points.csv. - Edge distances, maximum speeds, road types, and capacity limits are taken directly
from
edges.csv. - Truck payload (100 t) and speed factors are taken from
trucks.csv. - The ramp edges (E03_UP, E03_DOWN) have capacity 1, making them the intended structural bottleneck.
- The bypass route (J2→J7→J8→J4) exists as an alternative when the ramp is closed or congested, with edges E15, E16, E17 having capacity 999.
Introduced by the Model
- Routing policy: shortest-time path computed with Dijkstra’s algorithm over open edges, where edge traversal time = distance / (max_speed × speed_factor). Capacity-constrained edges include expected wait time in the cost estimate.
- Dispatch policy:
nearest_available_loader— assign the idle loader with the shortest expected travel time from the truck’s current position. Tie-breaker:shortest_expected_cycle_time— prefer the loader that minimises total expected cycle duration including queue wait. - Travel time noise: Each edge traversal time is perturbed by a multiplicative factor sampled from a truncated normal distribution with coefficient of variation CV = 0.10 (i.e., SD = 10 % of mean travel time, truncated at ±30 %).
- Loading/dumping time floor: Truncated normal distributions are lower-bounded at 1 minute to avoid zero or negative service times.
- In-flight cycle counting: At shift end, trucks that have completed loading but have not yet dumped are counted as partial credit (ore in transit); trucks still loading or travelling empty are not counted.
- No warmup period: The baseline scenario uses no warmup (warmup_minutes = 0); all trucks start from PARK at time 0.
- Reproducibility: Each replication uses seed
base_random_seed + replication_indexto ensure independent, reproducible streams.
Limitations
- No equipment failures or random breakdowns.
- No shift-change effects (continuous 8-hour operation).
- No fuel or maintenance constraints.
- No ore blending or grade tracking.
- Single loader per loading point (no shovel relocation).
- Road capacity modelled as a count of simultaneous trucks, not a physical queue length.
- No interaction between loaded and empty trucks on shared edges (both directions modelled as separate, independent resources).
- Bypass route capacity is unlimited (999); in reality a bypass may also have width constraints.
- The model does not account for truck acceleration/deceleration profiles.
Performance Measures
| Measure | Definition | How Computed |
|---|---|---|
| Tonnes per hour (t/h) | Total ore delivered to crusher divided by shift duration | tonnes_delivered / shift_length_hours per replication; mean and 95 % CI across replications |
| Total tonnes delivered | Cumulative ore dumped at CRUSH per shift | Sum of 100 t increments at each dump event |
| Truck cycle time (min) | Time from truck dispatch to end of dump | Recorded for each completed cycle; mean and SD reported |
| Loader utilisation | Fraction of shift time a loader is actively loading | resource_busy_time[loader] / shift_length_seconds |
| Crusher utilisation | Fraction of shift time the crusher is actively dumping | resource_busy_time[crusher] / shift_length_seconds |
| Queue wait time (min) | Mean time trucks wait for each resource | total_wait_time[resource] / number_of_service_events |
| Top bottlenecks | Resources with highest utilisation or wait time | Ranked by utilisation across all resources |
| 95 % confidence interval | Uncertainty estimate on mean t/h | mean ± 1.96 × (SD / sqrt(replications)) |
Results are aggregated across 30 replications per scenario and written to results.csv
(one row per replication) and summary.json (scenario-level statistics).
README
Synthetic Mine Throughput — SimPy Discrete-Event Simulation
A discrete-event simulation of an open-pit mine haulage system built with SimPy. Six operational scenarios are modelled over an 8-hour shift with 30 replications each.
Install
Python 3.11+ is recommended.
pip install -r requirements.txtOr with uv:
uv syncHow to Run
Run all six required scenarios:
python run.pyRun a single scenario:
python run.py --scenario baselineRun with a custom replication count:
python run.py --scenario baseline --replications 30Available scenario IDs: baseline, trucks_4, trucks_12, ramp_upgrade,
crusher_slowdown, ramp_closed.
Run with a warmup period (excludes the first N minutes from queue / utilisation
statistics; throughput denominator becomes shift - warmup):
python run.py --scenario baseline --warmup-minutes 30Shipped scenarios use warmup_minutes: 0; the CLI flag overrides that for ad hoc
steady-state analysis.
How to Reproduce Results
Seeds are controlled per replication: seed = base_random_seed + replication_index.
The baseline scenario uses base_random_seed = 12345, giving seeds 12345–12374
across 30 replications. All other scenarios inherit this setting unless overridden
in their YAML. Running python run.py with no arguments reproduces the published
results.csv, summary.json, and event_log.csv exactly.
Conceptual Model
See conceptual_model.md for the full model description.
Summary: Trucks cycle from a central parking area to one of two ore loaders
(North Pit or South Pit), then travel loaded to the primary crusher, dump 100 t,
and return empty. Resources that can form queues — loaders, crusher, and single-lane
road segments — are modelled as SimPy Resource objects. The dispatcher assigns each
idle truck to the nearest available loader, breaking ties by shortest expected cycle
time. Routing uses shortest-time Dijkstra over open edges, so the bypass route
(J2→J7→J8→J4) is used automatically when it is faster than the main ramp.
Main Assumptions
- Loader and crusher service times are sampled from truncated normal distributions parameterised by mean and SD from the input CSV files.
- Travel time per edge has multiplicative noise with CV = 0.10 (10 % standard deviation).
- All trucks start at PARK at time 0; no warmup period.
- A dump cycle is counted if
dump_start < shift_end; a 60-minute grace window allows trucks already at the crusher at shift end to complete their delivery. - Capacity-constrained edges (capacity < 999 in
edges.csv) are modelled as SimPyResourceobjects with that capacity; all other edges are delay-only. - No breakdowns, maintenance, shift changes, or fuel constraints.
For the full assumptions list see conceptual_model.md.
Routing and Dispatching Logic
Routing: Shortest-time Dijkstra over open edges. Edge traversal time is computed as
distance / (max_speed_kph × speed_factor), where speed_factor = 0.85 when loaded
and 1.00 when empty. Closed edges are excluded from the graph. If no path exists the
simulation raises an error rather than producing silent wrong results.
Dispatching: nearest_available_loader — the idle truck is assigned to the loader
with the shortest expected travel time from the truck’s current position. When two
loaders have equal travel time the tie is broken by shortest_expected_cycle_time,
which accounts for estimated queue wait at each loader.
Capacity-constrained segments: Edges with capacity = 1 in edges.csv are wrapped
as SimPy Resource(env, capacity=1). A truck must acquire the resource before
traversing the edge and releases it on arrival. Separate resources are used for each
direction. Affected edges in the baseline topology:
| Edge | Route | Direction |
|---|---|---|
| E03_UP | J2 → J3 (main ramp) | Outbound |
| E03_DOWN | J3 → J2 (main ramp) | Inbound |
| E05_TO_CRUSH | J4 → CRUSH | Outbound |
| E05_FROM_CRUSH | CRUSH → J4 | Inbound |
| E07_TO_LOAD_N | J5 → LOAD_N | Outbound |
| E07_FROM_LOAD_N | LOAD_N → J5 | Inbound |
| E09_TO_LOAD_S | J6 → LOAD_S | Outbound |
| E09_FROM_LOAD_S | LOAD_S → J6 | Inbound |
The bypass route (E15/E16/E17) has capacity 999 and is treated as unconstrained.
Key Results
All figures are from summary.json, 30 replications × 8-hour shift.
95 % CI computed using Student’s t-distribution with df = n − 1
(scipy.stats.t.interval(0.95, df=29)).
| Scenario | Trucks | t/h (mean) | 95 % CI | Crusher util | Avg cycle (min) |
|---|---|---|---|---|---|
| baseline | 8 | 1620 | [1611, 1629] | 0.95 | 28.9 |
| trucks_4 | 4 | 977 | [972, 981] | 0.57 | 24.1 |
| trucks_12 | 12 | 1625 | [1612, 1637] | 0.95 | 42.7 |
| ramp_upgrade | 8 | 1629 | [1620, 1639] | 0.95 | 28.8 |
| crusher_slowdown | 8 | 820 | [812, 828] | 0.96 | 55.9 |
| ramp_closed | 8 | 1610 | [1599, 1621] | 0.95 | 29.1 |
Answers to the 6 Operational Decision Questions
Q1: What is the baseline throughput?
1620 t/h [95 % CI: 1611–1629], equivalent to 12,960 t per 8-hour shift. Mean truck cycle time is 28.9 minutes. The crusher runs at 95 % utilisation, indicating it is near saturation under the baseline 8-truck fleet.
Q2: What are the likely bottlenecks?
The top_bottlenecks ranking in summary.json (sorted by utilisation, then queue time)
lists D_CRUSH (crusher) first in every scenario:
| Scenario | Top bottleneck | Utilisation | Mean queue (min) |
|---|---|---|---|
| baseline | D_CRUSH | 0.95 | 4.6 |
| trucks_4 | D_CRUSH | 0.57 | 0.8 |
| trucks_12 | D_CRUSH | 0.96 | 17.2 |
| ramp_upgrade | D_CRUSH | 0.95 | 4.6 |
| crusher_slowdown | D_CRUSH | 0.96 | 27.9 |
| ramp_closed | D_CRUSH | 0.95 | 4.7 |
The crusher is the binding resource in every configuration except trucks_4, where it
runs at 0.57 utilisation and the fleet is the binding constraint instead. The South
loader (L_S) is consistently second-highest by utilisation (0.91 baseline, 0.92
trucks_12) because the dispatcher preferentially sends trucks to the faster loader when
it is idle.
Note on the narrow ramp (E03_UP). A naive ranking by mean queue time would surface
E03_UP at the top of the baseline list (6.0 min mean queue), but its utilisation is
only 3.3 % — inconsistent with a true bottleneck. This queue is a startup-stampede
artifact: at t = 0 all 8 trucks dispatch simultaneously, the nearest-loader policy
sends them all toward L_S via E03_UP, and they queue once. After the first cycle, the
fleet has spread across both loaders and E03_UP is essentially unused — routing for
L_N already bypasses it via J2→J7→J5. Sorting top_bottlenecks by utilisation (with
queue time as tiebreaker) removes this misleading artifact while leaving the underlying
data visible in results.csv.
Q3: How sensitive is throughput to fleet size?
| Fleet | t/h | Change vs. baseline |
|---|---|---|
| 4 trucks | 977 | −40 % |
| 8 trucks (baseline) | 1620 | — |
| 12 trucks | 1625 | +0.3 % |
The system is strongly fleet-limited below 8 trucks and crusher-saturated above 8. Adding trucks beyond the baseline provides almost no gain (1625 vs. 1620 t/h, within the confidence intervals). The crusher service rate (~3.5 min per dump, capacity 1) sets a theoretical ceiling of approximately 1629 t/h under the baseline payload and shift length. Any further throughput gain requires either a faster crusher or a second crusher rather than additional trucks.
Q4: What is the impact of upgrading the main ramp?
Marginal: 1629 t/h vs. 1620 t/h baseline — a 0.6 % improvement, within noise.
The ramp upgrade (E03_UP/DOWN capacity raised to 999, speed raised from 18/22 to
28 km/h) removes the capacity constraint on the main ramp. However, the baseline
routing already directs L_N-bound trucks via the bypass (J2→J7→J5), which is faster
than the narrow ramp. Only L_S-bound trucks use E03, and these are spread out enough
in steady state that the ramp is not a binding constraint. The ramp is correctly absent
from the top_bottlenecks list in both baseline and ramp_upgrade once results are
ranked by utilisation, confirming the ramp was not limiting throughput.
Recommendation: Do not invest in a ramp upgrade to increase throughput. The crusher is the binding resource.
Q5: How sensitive is throughput to crusher service time?
Highly sensitive: a doubling of mean dump time (3.5 → 7.0 min) drops throughput by 49 % (1620 → 820 t/h).
Under crusher_slowdown, the crusher remains at 0.96 utilisation but now processes trucks at half the rate. Mean crusher queue time rises from 4.6 to 27.9 minutes, and average truck cycle time extends from 28.9 to 55.9 minutes. Loader utilisations drop sharply (L_S: 0.91 → 0.42; L_N: 0.50 → 0.37) as trucks spend most of their cycle waiting at the crusher. The system is highly sensitive to crusher throughput because the crusher is the single-server bottleneck for the entire fleet.
Recommendation: Crusher reliability and service rate are the most critical operational parameters. Even moderate crusher slowdowns (e.g. blocked chutes, liner wear) will have a disproportionate effect on shift tonnage.
Q6: What happens if the main ramp is closed?
Small impact: 1610 t/h vs. 1620 t/h baseline — a 0.6 % reduction. Rerouting via the bypass is fully viable.
When E03_UP and E03_DOWN are closed, the router automatically finds paths through the western bypass (J2→J7→J8→J4 for L_S-bound trucks; J2→J7→J5 for L_N-bound trucks). The bypass adds some travel distance but the route times are comparable. Crusher utilisation remains at 0.95 and truck utilisation is essentially unchanged (0.783 baseline vs. 0.782 ramp_closed). The confidence intervals overlap substantially ([1611–1629] baseline vs. [1599–1621] ramp_closed), so the difference is not statistically significant at the 95 % level.
Note: In results.csv, the edge_E03_UP_queue_time and edge_E03_DOWN_queue_time
columns are 0.0 for ramp_closed and ramp_upgrade scenarios — this is correct because
those edges do not exist as resources in those scenarios (closed or unconstrained
respectively), not a data error.
Recommendation: The bypass provides adequate rerouting capacity. A ramp closure need not halt production, though travel times are slightly longer for L_S-bound trucks.
Likely Bottlenecks
Based on utilisation and queue-time analysis across all scenarios:
-
Crusher (D_CRUSH) — the primary steady-state bottleneck in all scenarios except trucks_4. Utilisation 0.95–0.96; mean queue wait 4.6–27.9 min depending on service rate. Any reduction in crusher throughput has an immediate and disproportionate effect on overall t/h.
-
Loader South (L_S) — consistently second-highest utilisation (0.91 baseline, 0.92 trucks_12). The South loader is faster (4.5 min mean) but heavily loaded because the dispatcher preferentially assigns trucks there when it is idle. Queue time 1.6 min baseline, rising to 2.2 min with 12 trucks.
-
Crusher approach road (E05_TO_CRUSH) — single-lane access to the crusher, utilisation ~0.43–0.45. Not a bottleneck at current fleet sizes but could become one if throughput increases.
-
South pit return road (E09_FROM_LOAD_S) — single-lane pit access, utilisation ~0.48 baseline. Co-occupies the South pit cycle alongside L_S; not currently binding but the highest-utilisation road segment.
A startup-transient artifact appears on E03_UP (high queue time, ~3 % utilisation) for the first ~20 minutes of each replication while the fleet spreads from PARK. This is correctly excluded from the bottleneck ranking by sorting on utilisation; see Q2.
Limitations
- No equipment breakdowns or random downtime for trucks, loaders, or crusher.
- No shift changes, refuelling stops, or operator breaks during the 8-hour window.
- Opposing-direction traffic on physically single-lane segments does not interact via meet-and-pass logic; each direction is an independent SimPy resource.
- Bypass route (E15–E17) is treated as unconstrained (capacity 999); in reality a bypass may have width or grade limits.
- The shipped scenarios use
warmup_minutes: 0, so a startup-stampede transient on E03_UP is visible in the early minutes of each replication. Warmup support is implemented in the runner — pass--warmup-minutes 30on the CLI to exclude the transient from queue and utilisation statistics for ad-hoc analysis. - Ore is delivered in fixed 100-tonne increments; no partial payloads or blend control.
- Truck speed is a constant factor per edge; no acceleration/deceleration or switchback effects.
- Service time distributions are simple truncated normals; bimodal or heavy-tailed effects (e.g. blocked chutes, swell factors) are not captured.
- The
edge_E03_UP_queue_timeandedge_E03_DOWN_queue_timecolumns inresults.csvare 0.0 forramp_upgradeandramp_closedscenarios because those edges are removed as constrained resources in those scenarios — this is expected behaviour, not missing data.
Suggested Improvements and Further Scenarios
-
Warmup period in shipped scenarios —
warmup_minutessupport is implemented in the runner but the shipped YAMLs use0. Bump baseline to 30–60 min in the YAML to make the bottleneck ranking and queue-time statistics reflect steady-state operation only. The CLI override (--warmup-minutes 30) provides the same effect ad hoc. -
Stochastic breakdowns — model loader and crusher failures using exponential time-to-failure and lognormal repair times to assess availability risk.
-
Second crusher scenario — add a second crusher unit to test whether a parallel dump point breaks the current throughput ceiling.
-
Shift-change scenario — introduce a 15-minute production pause at hour 4 to quantify the tonnage cost of crew changeover.
-
Dynamic dispatch with real-time queue feedback — upgrade the dispatcher to use live queue lengths rather than estimated wait times for assignment decisions.
-
Bypass capacity constraint scenario — set E15/E16/E17 capacity to 1 or 2 to test whether the bypass becomes a bottleneck if the ramp is closed long-term.
-
Sensitivity analysis on CV — vary travel time noise (CV = 0.05, 0.10, 0.20) to quantify how road condition variability affects throughput confidence intervals.
Output Files
| File | Description |
|---|---|
results.csv | One row per replication per scenario (180 rows); scenario-level and replication-level metrics |
summary.json | Scenario-level statistics: mean t/h, 95 % CI, utilisations, queue times, bottleneck ranking |
event_log.csv | Full event trace (~92,000 events); columns: time, truck_id, event_type, node, tonnes |
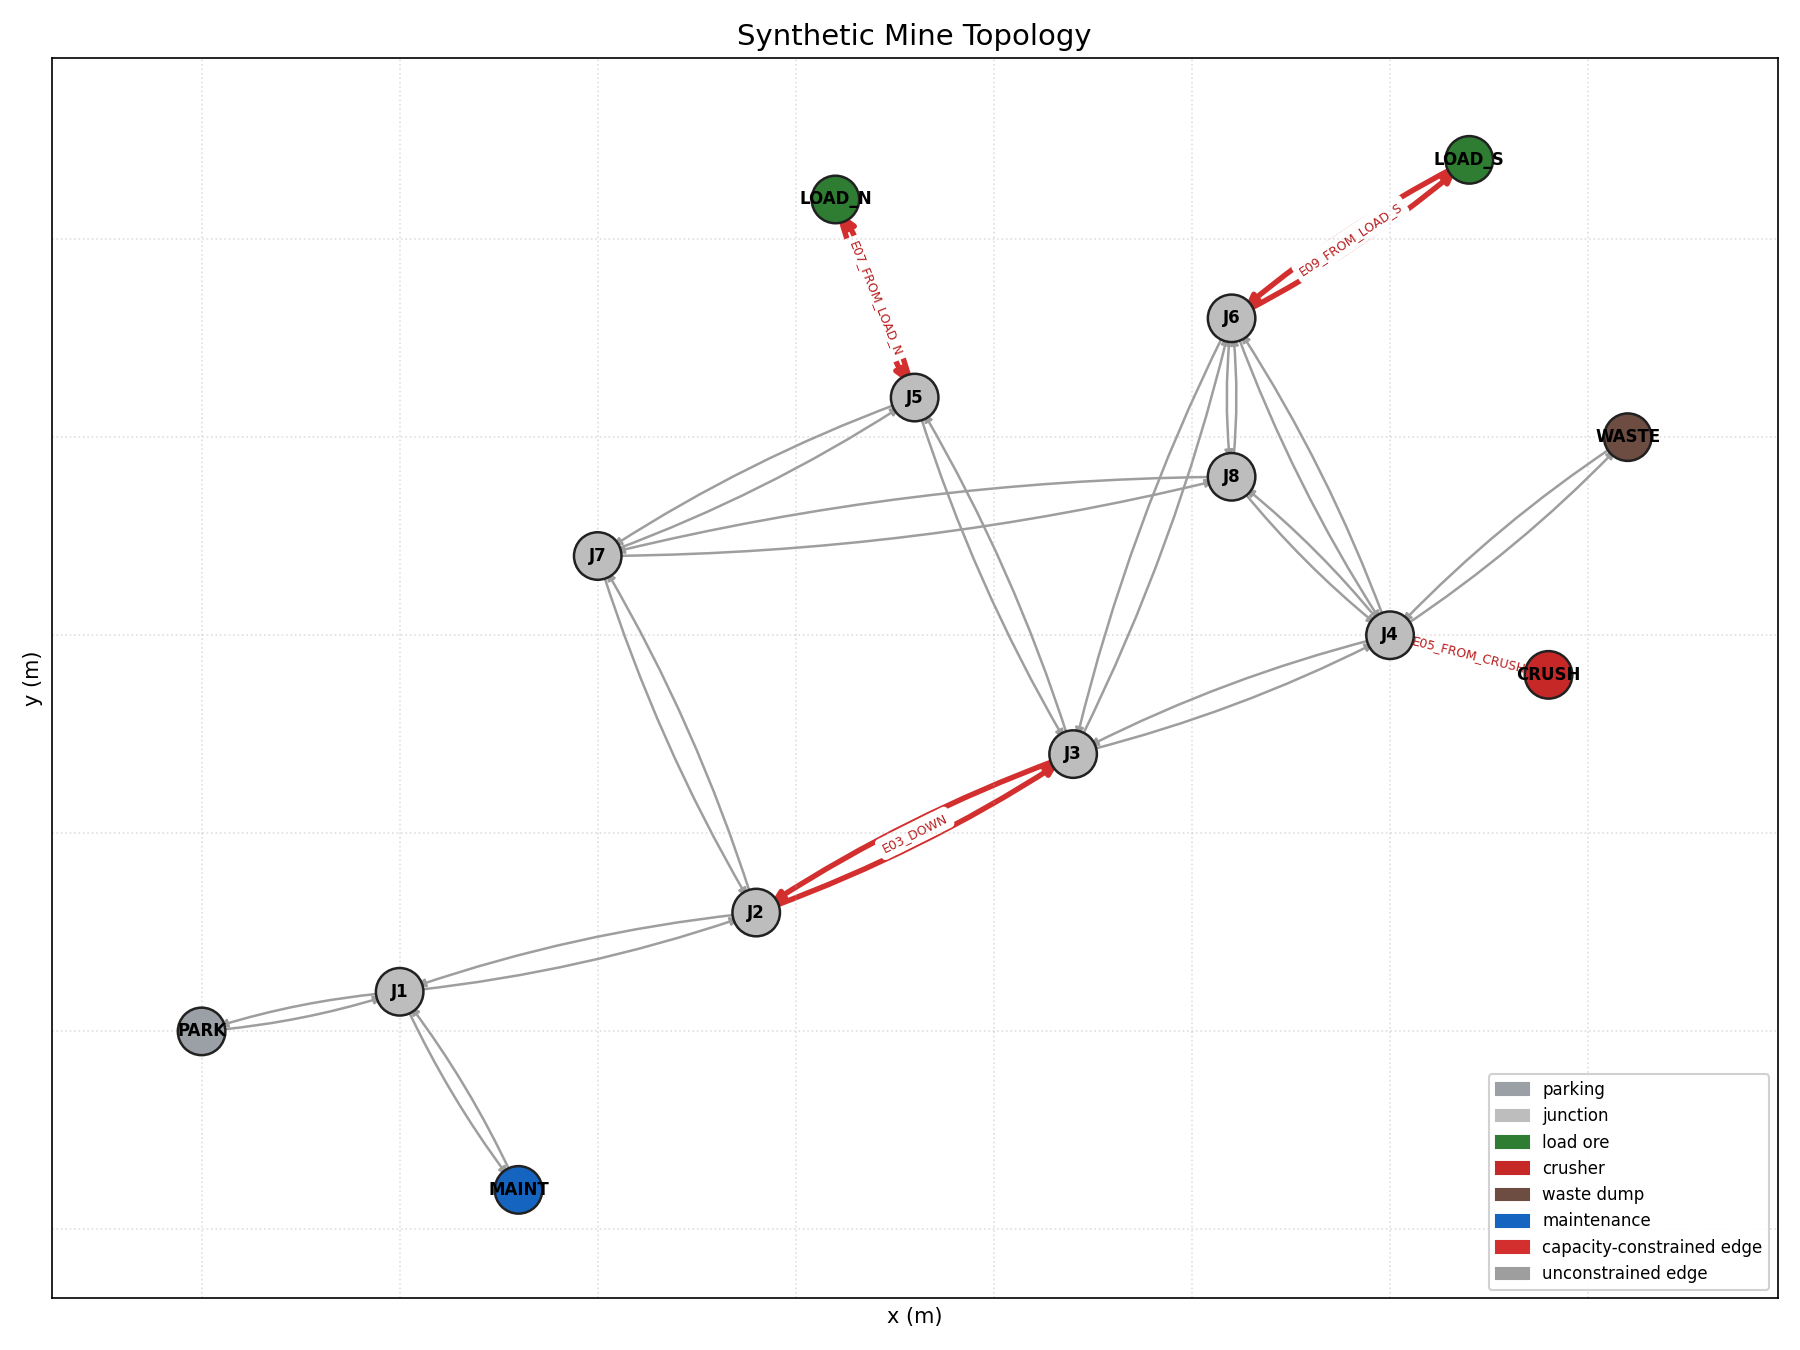
topology.png | Visualisation of the road network graph with node types and edge capacities |
conceptual_model.md | Formal conceptual model document |