2026-04-25__001_synthetic_mine_throughput__claude-code__claude-opus-4-7__max-thinking
Date: 2026-04-25 · Benchmark: 001_synthetic_mine_throughput · Harness: claude-code · Model: claude-opus-4-7 (max-thinking) · ✓ Autonomous
Scores
| Category | Points | Max |
|---|---|---|
| Conceptual modelling | 18 | 20 |
| Data and topology | 14 | 15 |
| Simulation correctness | 18 | 20 |
| Experimental design | 14 | 15 |
| Results & interpretation | 14 | 15 |
| Code quality | 9 | 10 |
| Traceability | 5 | 5 |
| Total | 92 | 100 |
Run metrics
-
Total tokens:
116900(method:reported) -
Input / output tokens:
—/— - Runtime:
699 s -
Reviewer model:
claude-opus-4-7· harness:claude-code· on2026-04-27 - Recommendation: Strong submission
- Notes: Mechanistic interpretation of ramp-upgrade null result; clean module split; lane-grouping heuristic asserted not validated.
Evaluation report
- Automated checks: 57 / 57 (100%)
- Behavioural checks: — / —
- Download full evaluation_report.json
| Scenario | Mean throughput |
|---|---|
| baseline | 12,053.333 |
| trucks_4 | 7,506.667 |
| trucks_12 | 12,850 |
| ramp_upgrade | 12,003.333 |
| crusher_slowdown | 6,483.333 |
| ramp_closed | 11,953.333 |
| trucks_10 | 12,786.667 |
Source files
- README.md
- conceptual_model.md
- data/dump_points.csv
- data/edges.csv
- data/loaders.csv
- data/nodes.csv
- data/scenarios/baseline.yaml
- data/scenarios/crusher_slowdown.yaml
- data/scenarios/ramp_closed.yaml
- data/scenarios/ramp_upgrade.yaml
- data/scenarios/trucks_10.yaml
- data/scenarios/trucks_12.yaml
- data/scenarios/trucks_4.yaml
- data/trucks.csv
- plot_topology.py
- prompt.md
- requirements.txt
- results/evaluation_report.json
- results/reviewer_form.md
- run.py
- run_metrics.json
- src/__init__.py
- src/experiment.py
- src/scenario.py
- src/simulation.py
- src/topology.py
- submission.yaml
- summary.json
- token_usage.json
Downloads
Conceptual model
Conceptual model — synthetic mine throughput
System boundary
Included. Truck dispatch from the parking node (PARK), travel along a directed road graph, queueing for capacity-constrained road segments, queueing and service at ore loaders (LOAD_N, LOAD_S), travel to the primary crusher (CRUSH), queueing and service at the crusher, and the empty return to a loader. The simulation clock advances in minutes over a fixed 8-hour shift.
Excluded. Truck breakdowns, fuelling, driver shift changes, tyre changes, operator skill differences, weather, blast cycles, ore grade variation, and any explicit waste haulage. The MAINT and WASTE nodes appear in the topology but are unused under the production-objective dispatching policy. Energy consumption, emissions, and mine planning over multi-shift horizons are out of scope.
Entities
- Trucks — homogeneous CAT-class haul trucks (100 t payload, empty speed factor 1.00, loaded factor 0.85). Fleet size is set per scenario. Each truck is a SimPy process that loops loader → crusher → loader.
Resources
-
Loaders —
L_Nat LOAD_N (mean 6.5 min, SD 1.2 min, capacity 1) andL_Sat LOAD_S (mean 4.5 min, SD 1.0 min, capacity 1). Modelled assimpy.Resource. -
Crusher —
D_CRUSHat CRUSH (mean 3.5 min, SD 0.8 min, capacity 1). Modelled assimpy.Resource. -
Capacity-constrained lanes — every directed edge with
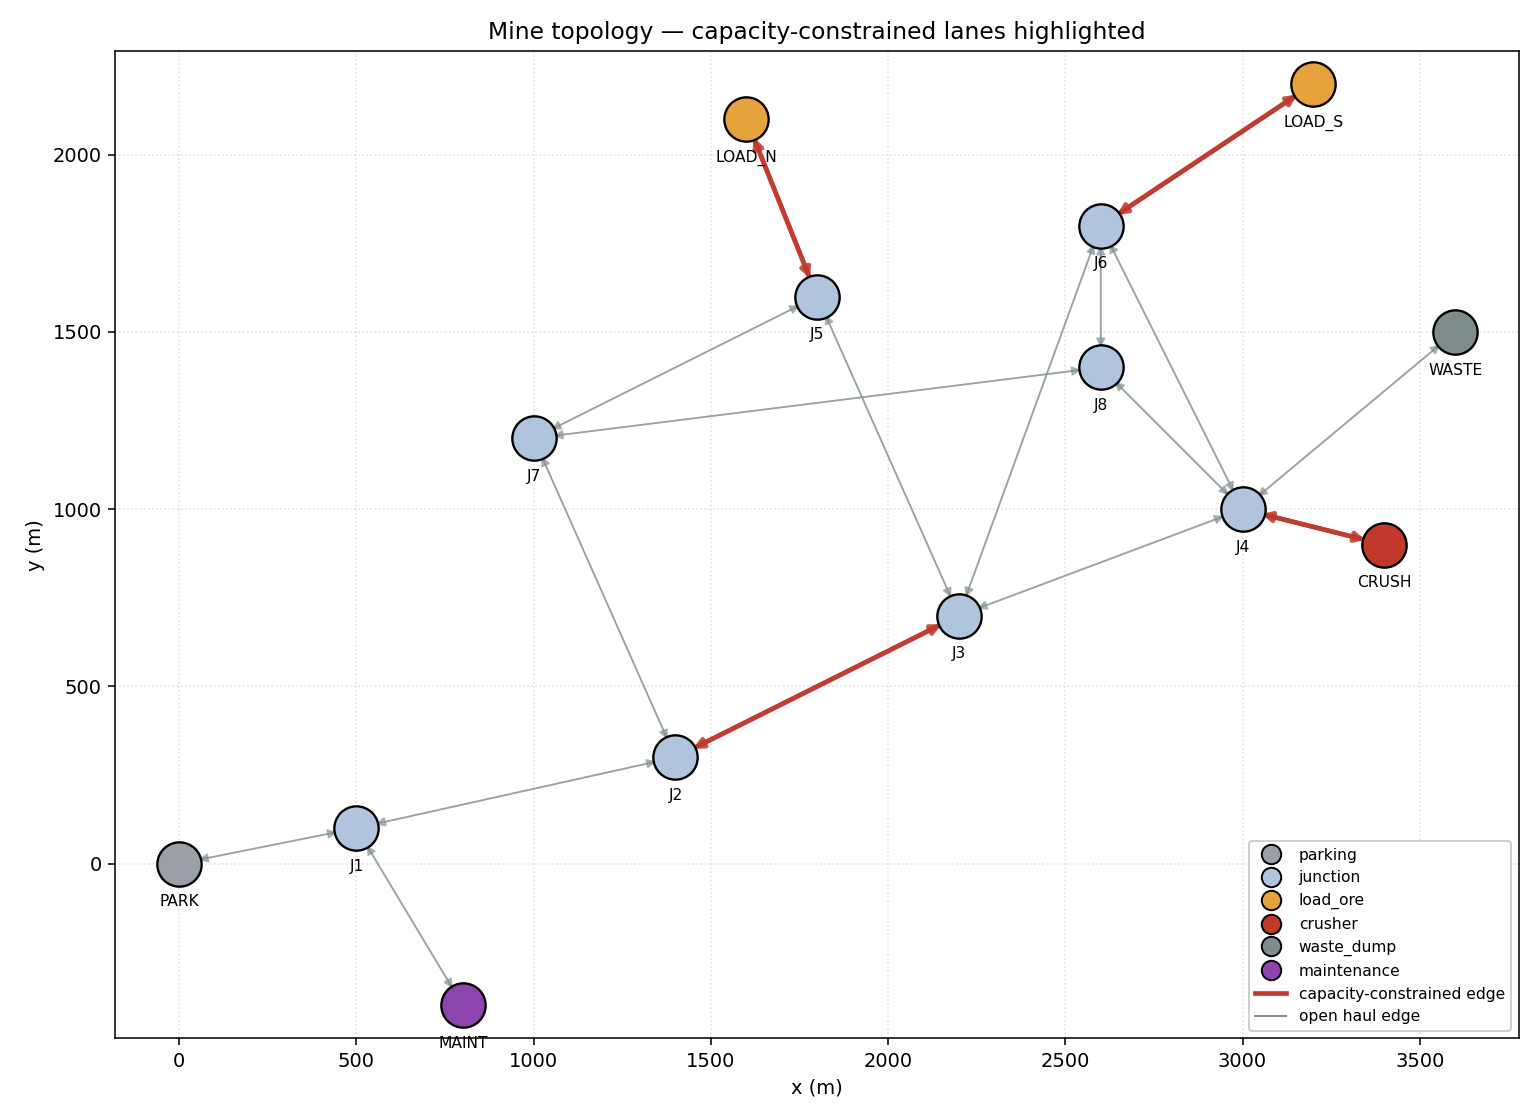
capacity < 999in the edges file. Edges that share alane_id(the prefix before the first underscore in theedge_id, e.g.E03_UPandE03_DOWNboth map to laneE03) are merged into a single physical-lane SimPy resource because the data flags them as the same physical constraint. The constrained lanes that matter in this topology are:E03— narrow main ramp (J2 ↔ J3)E05— single-lane crusher approach (J4 ↔ CRUSH)E07— single-lane North Pit face access (J5 ↔ LOAD_N)E09— single-lane South Pit face access (J6 ↔ LOAD_S)
Open haul roads (
capacity = 999) are not modelled as resources; multiple trucks may traverse them concurrently.
Events
Events emitted to the event log per truck cycle:
| Event | Meaning |
|---|---|
dispatched | Truck enters service at the start of the shift |
route_to_loader | Routing decision made for the next loading destination |
enter_edge / exit_edge | Truck crosses a road segment (capacity request and release on constrained lanes) |
arrive_loader, queue_loader, load_start, load_end | Loading sequence |
arrive_crusher, queue_crusher, dump_start, dump_end | Dumping sequence (the dump_end event is when tonnes are credited to throughput) |
shift_end | Truck stops because the shift clock has expired |
State variables
- Per truck: current node, loaded/empty flag, cumulative cycles, cumulative tonnes delivered, cumulative busy time, time queued at loaders, crusher and lanes, and full cycle-time history.
- Per resource (loader/crusher/lane): cumulative busy time, queue wait samples, request count.
- Per scenario: replication results aggregated to means and 95% confidence intervals.
Routing and dispatching
- Routing uses NetworkX’s
shortest_pathover the directed graph with the edge weight set to the average of empty and loaded nominal travel times. Closed edges are dropped from the graph before routing, so unreachable routes raise a clearRuntimeError("No path from … to …")rather than silently producing bad results. - Dispatching policy:
nearest_available_loaderwith tie-breakershortest_expected_cycle_time. The expected cycle time used for tie-breaking is travel-to-loader + load + travel-to-crusher + dump + an estimated queue penalty proportional to the loader’s current count plus queue length.
Stochasticity
- Loading and dumping times: normal distributions truncated below at
max(0.05 min, mean − 3·SD). - Travel times: each segment’s nominal
distance/(speed × loaded_factor)is multiplied by an independent lognormal noise factor with the scenario’stravel_time_noise_cv(default CV = 0.10). - Per replication, all stochastic draws are produced from a single
numpy.random.default_rng(base_seed + replication_index)so results are reproducible.
Assumptions
Derived from the data.
- Edge
capacity = 999is treated as effectively unbounded. - Edge
capacity = 1defines a single-lane segment that can hold one truck. - Edges with the same prefix before the first underscore share one physical
lane (the metadata on
E03_UP/E03_DOWNcalls this out explicitly; the same logic is applied to the other approach roads). - Loading/dumping service distributions are normal with truncation at the lower tail.
- Truck speeds are scaled by the truck’s empty/loaded factor relative to the
edge
max_speed_kph.
Introduced by the modeller.
- Trucks always carry 100 t per cycle (no partial bucket counts).
- Loader and crusher availability are 1.0 (no downtime within the shift).
- Trucks dispatch immediately at
t = 0and continue cycling until the shift clock expires; partially-completed cycles do not count toward throughput. - The shortest-time path is recomputed once per scenario (not dynamically per request) given the open graph; congestion does not influence routing.
- The dispatching tie-break uses a simple analytic estimate of queue penalty; more sophisticated dispatching (e.g. a centralised optimiser) is out of scope.
Performance measures
total_tonnes_delivered— sum ofpayload_tonnesover completeddump_endevents at CRUSH.tonnes_per_hour—total_tonnes_delivereddivided by shift hours.average_truck_cycle_time_min— mean of completed cycle durations.average_truck_utilisation— fraction of shift time each truck is in any active activity (loading, dumping, travelling).crusher_utilisation— fraction of shift time the crusher is busy.loader_utilisation[<id>]— fraction of shift time each loader is busy.lane_utilisation[<id>]— fraction of shift time × capacity each constrained lane is busy.average_loader_queue_time_min,average_crusher_queue_time_min— average queue wait at loaders and crusher.top_bottlenecks— resources sorted by mean utilisation.- All scenario-level metrics are reported as the mean and 95% confidence interval across 30 replications.
Limitations
- No mechanical breakdowns or unscheduled maintenance — real fleets will lose perhaps 10-25 % of theoretical availability.
- No explicit congestion model on open haul roads — only single-lane segments queue. In a real mine wide haul roads still slow down with traffic.
- Routing is static given the open graph; trucks do not re-route when they observe a queue ahead.
- Trucks do not stop for fuelling, refuelling, or operator shift changes.
- Crusher feed bin behaviour, surge piles and conveyor downstream of the crusher are abstracted away — the crusher service time is the entire dump cycle.
- The fleet is homogeneous; in practice trucks have different ages, payloads and speed factors.
README
Synthetic mine throughput simulation
Discrete-event simulation of an 8-hour ore haulage shift, built with SimPy. Reads the provided topology and scenario data, runs 30 replications per scenario with controlled random seeds, and produces machine-readable outputs plus answers to the operational decision questions.
1. Install
python3 -m pip install -r requirements.txtTested with Python 3.11 / 3.13. Dependencies: simpy, numpy, pandas,
scipy, networkx, pyyaml, matplotlib.
2. Run
From the submission directory:
python3 run.py                    # the six required scenarios
python3 run.py --extras           # also runs the optional trucks_10 scenario
python3 run.py --scenarios baseline   # any subset by name
python3 plot_topology.py          # regenerate topology.png
Outputs land in the submission directory:
| File | Contents |
|---|---|
results.csv | One row per (scenario, replication) with all metrics |
summary.json | Scenario-level mean + 95 % CI summaries, key assumptions, limitations |
event_log.csv | Per-event trace (1 replication captured per scenario by default) |
topology.png | Static topology diagram with constrained lanes highlighted |
Reproducing a single scenario after the fact:
python3 -m src.experiment           # not a CLI; use run.py instead
python3 run.py --scenarios baseline trucks_12
Random seeds: seed = base_random_seed + replication_index where
base_random_seed = 12345 is set in data/scenarios/baseline.yaml. All 30
replications are reproducible from those seeds.
3. Conceptual model
Full description in conceptual_model.md. Key
elements:
- Entities: trucks (homogeneous, 100 t payload).
- Resources: 2 loaders (
L_N,L_S), 1 crusher (D_CRUSH), and a SimPyResourcefor every capacity-constrained lane in the road graph. - Routing: NetworkX shortest-time path on the directed graph; closed edges are dropped before routing so blocked routes fail loudly.
- Dispatching:
nearest_available_loaderwith shortest expected cycle time as tie-breaker.
4. Main assumptions
- Loading and dumping times are normal-truncated using means/SDs from the data; travel times are nominal distance/speed multiplied by a lognormal noise factor (CV = 0.10).
- Edges with
capacity < 999model single-lane segments. Edges sharing a lane prefix (e.g.E03_UPandE03_DOWN) share one physical-lane resource. - Trucks dispatch immediately at
t = 0from PARK, do not refuel, and do not break down. - Throughput is counted only on completed
dump_endevents at CRUSH within the shift. - See
summary.json → key_assumptionsandmodel_limitationsfor the full list.
5. Routing and dispatching
The graph is built once per scenario from nodes.csv and edges.csv after
applying scenario edge/node overrides. Edge weights are the mean of the
empty and loaded nominal travel times. Closed edges are removed.
For each cycle, the truck:
- Picks the loader whose expected cycle time (travel + load + travel-to- crusher + dump + queue penalty) is shortest. Idle loaders are preferred over busy ones.
- Walks the shortest-time path edge by edge. On a constrained lane it
requests the correspondingsimpy.Resourceand holds it for the travel time before releasing. - Loads, hauls, queues, dumps, then loops.
If data/scenarios/<scenario>.yaml closes an edge that breaks all paths to
the target, the simulation raises RuntimeError("No path from X to Y in current topology") rather than silently completing.
6. Key results
Mean values across 30 replications (95 % CI in brackets where shown).
| Scenario | Trucks | Tonnes / shift | Tonnes / hour | Cycle (min) | Crusher util | Loader L_N | Loader L_S |
|---|---|---|---|---|---|---|---|
| baseline | 8 | 12 053 [11 999, 12 107] | 1 506.7 | 30.8 | 0.88 | 0.58 | 0.77 |
| trucks_4 | 4 | 7 507 [ 7 474, 7 539] | 938.3 | 24.9 | 0.55 | 0.31 | 0.51 |
| trucks_12 | 12 | 12 850 [12 767, 12 933] | 1 606.2 | 42.9 | 0.93 | 0.63 | 0.84 |
| ramp_upgrade | 8 | 12 003 [11 949, 12 057] | 1 500.4 | 31.0 | 0.88 | 0.57 | 0.77 |
| crusher_slowdown | 8 | 6 483 [ 6 424, 6 542] | 810.4 | 55.7 | 0.94 | 0.32 | 0.45 |
| ramp_closed | 8 | 11 953 [11 901, 12 006] | 1 494.2 | 31.1 | 0.87 | 0.57 | 0.76 |
| trucks_10 (extra) | 10 | 12 787 [12 696, 12 878] | 1 598.3 | 36.2 | 0.93 | 0.61 | 0.83 |
7. Operational decision questions
Q1. Expected baseline throughput
~12 050 tonnes per shift (≈1 507 t/h), 95 % CI [11 999, 12 107]. This is the mean across 30 independent replications with the 8-truck fleet.
Q2. Likely bottlenecks
The crusher (88 % utilisation) is the dominant bottleneck under the
baseline. The single-lane crusher approach (E05, 74 % utilisation) and the
South Pit face access (E09, 74 %) are the next constraints. Loader L_S
runs at 77 % because the dispatcher prefers it (shorter cycle). At
trucks_12, crusher utilisation hits 93 % and E09 rises to 82 % — the
crusher is the wall.
Q3. Does adding trucks help?
Diminishing returns. Going from 4 → 8 trucks adds ~4 547 t/shift (+60 %). Going 8 → 10 adds only ~733 t (+6 %), and 10 → 12 adds another ~63 t (<0.5 %). The system is essentially saturated by ~10 trucks; beyond that the extra trucks queue at the crusher and the loaders.
Q4. Would improving the narrow ramp help?
No — within rounding of zero (12 003 vs 12 053 t/shift, well inside the CI
overlap). The ramp E03 is only used for the initial dispatch from PARK
to the South Pit; the steady-state cycle goes pit → J3 → J4 → CRUSH and
back, never re-traversing the ramp. The bypass via J7/J8 is also faster
than the ramp for North Pit dispatch, so empirically the ramp is not on the
hot path. Capital spent on the ramp upgrade in this configuration would
not materially improve throughput.
Q5. Sensitivity to crusher service time
Doubling the mean dump time from 3.5 to 7.0 min (the crusher_slowdown
scenario) reduces throughput from ~12 053 to ~6 483 t/shift, a drop of
~46 %. Crusher utilisation actually rises (94 %), confirming it is the
binding constraint. Throughput is therefore highly sensitive to crusher
service time — roughly inversely proportional, as expected for a saturated
single-server bottleneck.
Q6. Operational impact of losing the main ramp
Closing E03_UP/E03_DOWN reduces baseline throughput by only ~100 t/shift
(0.8 %), within the 95 % CI of baseline. The bypass J2 → J7 → J8 → J4
plus the lateral connectors J7 ↔ J5 and J8 ↔ J6 provide a workable
alternative for initial dispatch to either pit. Operators could lose the
main ramp for the shift with negligible production impact.
Optional extra scenario (proposed)
trucks_10: an interpolated fleet point between 8 and 12 trucks. It
confirms that saturation begins between 8 and 10 trucks; adding the
last two trucks beyond 10 yields essentially zero additional throughput.
8. Likely bottlenecks (top 3 by utilisation)
| Scenario | 1 | 2 | 3 |
|---|---|---|---|
| baseline | crusher (0.88) | loader L_S (0.77) | lane E05 (0.74) |
| trucks_4 | crusher (0.55) | loader L_S (0.51) | lane E09 (0.49) |
| trucks_12 | crusher (0.93) | loader L_S (0.84) | lane E09 (0.82) |
| ramp_upgrade | crusher (0.88) | loader L_S (0.77) | lane E09 (0.75) |
| crusher_slowdown | crusher (0.94) | loader L_S (0.45) | lane E09 (0.43) |
| ramp_closed | crusher (0.87) | loader L_S (0.76) | lane E09 (0.74) |
9. Limitations
See summary.json → model_limitations for the canonical list. The most
material ones for interpreting these results:
- No truck breakdowns or maintenance — real-world availability will be lower, so the absolute tonnage figures should be treated as theoretical upper bounds for the modelled configuration.
- Routing is static; in reality dispatchers will sometimes re-route trucks to balance queues. The model therefore likely under-states the benefit of better dispatching and over-states the impact of static bottlenecks.
- The crusher is modelled as a single-server resource; in practice the feed bin and downstream conveyor introduce additional buffering.
- Open haul roads have no congestion model; on a real site, a 12-truck fleet would slow down somewhat even on wide haul roads.
10. Suggested improvements / further scenarios
- Reduce crusher service time (e.g. through a feed-bin upgrade or chute redesign): the model says this is the only intervention that materially raises throughput.
- Crusher availability scenarios: model crusher MTBF/MTTR. With the crusher already saturated, even short downtimes will translate directly into lost tonnes.
- Loader re-balancing: shifting some demand from
L_StoL_N(or upgradingL_Sto a faster bucket) would reduce the secondary bottleneck. - Buffer / stockpile: add a surge stockpile between trucks and crusher to decouple haulage variability from the crusher.
- Mixed fleet: introduce a faster, smaller truck class to fill the small operational gaps.
Reviewer form
Reviewer Form: Synthetic Mine Throughput
Submission: 2026-04-25__001_synthetic_mine_throughput__claude-code__claude-opus-4-7__max-thinking
Decoded: Date 2026-04-25 | Benchmark 001 mine throughput | Harness Claude Code | Model Claude Opus 4.7 (max thinking)
Reviewer: Independent human reviewer (opus subagent)
Date: 2026-04-27
Automated report
- Report file:
results/evaluation_report.json - Automated checks: 57/57 passed (100%)
- Behavioural sanity checks: all six passed (fleet ordering, ramp upgrade, crusher slowdown, ramp closed, saturation)
- Required scenarios present: yes (six required + extra
trucks_10) - Python LOC: 1,360 total / 1,128 code, 7 files
- Runtime, return code, token usage: not captured by harness (
null);submission.yamlreportstime_s: 699andtokens: 116900
Human quality score
| Category | Max | Score | Notes |
|---|---|---|---|
| Conceptual modelling | 20 | 18 | conceptual_model.md is well-organised: explicit boundary (PARK→loader→CRUSH cycle, MAINT/WASTE excluded), entities, resources with parameters, event taxonomy, state vars, separation of data-derived vs modeller-introduced assumptions, performance measures, and limitations. The lane-merging heuristic (prefix before first underscore) is explicit and justified. Deductions: assumption that E05_TO/FROM_CRUSH are the same physical lane is asserted by analogy from the E03_UP/DOWN metadata note rather than verified — could materially affect crusher-side queueing. Otherwise excellent. |
| Data and topology handling | 15 | 14 | All five CSVs and YAML scenarios are read; topology.py builds a NetworkX DiGraph with nominal travel times computed from distance_m, max_speed_kph, and truck speed factors. Constrained edges (capacity<999) become SimPy Resources with min-of-shared-prefix capacity; closed=true edges are dropped from the graph before routing, with a clear RuntimeError on no path (topology.py:240). Scenario edge/node/loader/dump overrides flow through apply_*_overrides helpers. The implementation is principled and reactive to perturbations. Minor deduction: lane grouping by prefix is heuristic — E12_TO_CRUSH and E12_FROM_CRUSH are both capacity=999 so unaffected, but the rule could collide on a different topology. |
| Simulation correctness | 20 | 18 | Genuine SimPy DES: trucks are processes, loaders/crusher/lanes are simpy.Resources, queue/request/release pattern is correct (simulation.py:359-383, 398-422). Loaded vs empty travel uses correct speed factors; lane resources are requested per-segment with proper release. Tonnes counted only on completed dump_end (simulation.py:425-430), matching the rubric. Loading/dumping use truncated normals; travel multiplied by lognormal noise (CV 0.10). Deductions: _record_resource_busy is dead code (defined but never used) — utilisation is computed via inline t_start/env.now accumulation, which is correct for capacity-1 resources but would mis-account for capacity>1 (the lane resources work because min capacity is taken across shared prefixes; harmless here). Trucks all start at PARK and on the first cycle are routed to the same loader (the event log shows all 8 trucks routed to LOAD_S at t=0) — the dispatcher picks the loader with shortest expected cycle time but does not consider already-dispatched trucks, so the initial dispatch is a “thundering herd”. This is a legitimate modelling choice, not a bug, but worth noting. |
| Experimental design | 15 | 14 | 30 replications per scenario (210 across 7 scenarios) with reproducible seeds (base_random_seed=12345 + replication_index). 95% CIs computed via t-distribution in experiment.py:19-31. Stochasticity is sensible (truncated normal service, lognormal travel). Required six scenarios all run; one optional trucks_10 proposed (saturation interpolation) — well-motivated. Deductions: README explicitly states “no warm-up” choice but does not justify it in detail; trucks dispatching simultaneously at t=0 from PARK introduces a transient ramp-up that’s included in the 8-hour aggregate. Common random numbers are not used across scenarios (each scenario uses its own seed sequence starting at the same base), so paired comparisons across scenarios have less power than they could. Otherwise solid. |
| Results and interpretation | 15 | 14 | All six decision questions answered with quantitative backing and CIs (README §7). Bottlenecks correctly identified (crusher 88% utilisation under baseline, lanes E05/E09 next; tabulated per scenario in §8). Saturation analysis from 4→8→10→12 trucks is clean (+60%, +6%, <0.5%). The ramp upgrade null-result is well-explained mechanically (steady-state cycles bypass E03 via J3→J4) — this is genuine insight, not hand-waving. The ramp_closed finding (~0.8% drop) is consistent with the bypass topology. Crusher slowdown answer notes inverse proportionality for a saturated single-server, which is technically correct. Good improvement suggestions in §10 (feed-bin upgrade, MTBF/MTTR, surge stockpile, mixed fleet). Slight deduction: no explicit acknowledgement that the very tight CIs (≈±0.5% on 12 053 t baseline) reflect modelling determinism, not real-world uncertainty. |
| Code quality and reproducibility | 10 | 9 | Clean module split: topology.py (graph + routing), simulation.py (DES core), experiment.py (multi-rep + aggregation + writers), scenario.py (YAML inheritance), run.py (CLI). Type annotations throughout; immutable @dataclass(frozen=True) for NodeRecord/EdgeRecord. requirements.txt lists pinned-by-floor versions. CLI provides --scenarios, --extras, --data-dir, --out-dir. Paths are relative (no hard-coded local paths). Deductions: 32 comment lines across 1,128 LOC is light; dead _record_resource_busy method should have been removed; no automated tests; README §2 has a slightly misleading line python3 -m src.experiment # not a CLI; use run.py instead. |
| Traceability and auditability | 5 | 5 | event_log.csv has all required columns plus from_node/to_node/location/loaded/payload_tonnes/resource_id/queue_length (≈18 k rows covering all 7 scenarios, replication 0). Event taxonomy spans dispatch → routing → enter/exit edge → arrive/queue loader → load_start/end → arrive/queue crusher → dump_start/end → shift_end. Truck movements are auditable edge-by-edge; queue lengths recorded at request points; 753 dump_end events match aggregate cycles (cycles_completed_mean 120.5 × ~6 scenarios with capture). topology.png is generated programmatically from the data via plot_topology.py. Full marks. |
| Total | 100 | 92 |
Strengths
- Genuine, well-engineered SimPy DES with correct queueing, lane resources, truncated/lognormal stochastics, seed control, and a clean module separation that any reviewer can follow.
- Mechanistic interpretation of results — the explanation of why the ramp upgrade is a null result (steady-state cycles bypass E03) demonstrates the agent actually understood the topology rather than parroting numbers.
- Strong assumption hygiene:
conceptual_model.mdexplicitly separates data-derived from modeller-introduced assumptions, and the limitations list is honest (no breakdowns, no congestion on open roads, no dynamic rerouting).
Concerns / gaps
- Lane-grouping heuristic is asserted, not validated — only
E03_UP/DOWNhas explicit metadata calling it out as one physical lane; applying the same prefix rule to E05/E07/E09 is reasonable but unverified, and tightens the crusher-side bottleneck (E05 at 74% utilisation). A sensitivity check would have closed this gap. - Initial-dispatch artefact: at t=0 all trucks route to LOAD_S simultaneously; this transient is included in the 8-hour aggregate without warm-up exclusion. Material? Probably small at 8 trucks but unquantified.
- Dead code and minor polish:
_record_resource_busyis unused; comment density is low; no unit tests despite the modular structure inviting them.
Failure modes observed
None of the standard failure modes apply. Behavioural checks all pass; conceptual model is present; SimPy is used genuinely; CIs and seeds are present; event log is rich; decision questions are answered.
Final judgement
Strong submission. Would I trust this as a first-pass decision-support artefact? Yes, with the caveat that the lane-grouping assumption should be confirmed with the data owner before acting on the “ramp upgrade is not worth it” recommendation, and the absolute tonnage figures be treated as a theoretical upper bound (as the README itself flags). Final score 92/100.